Hello. Welcome to another great workout. This is a 3-star workout.
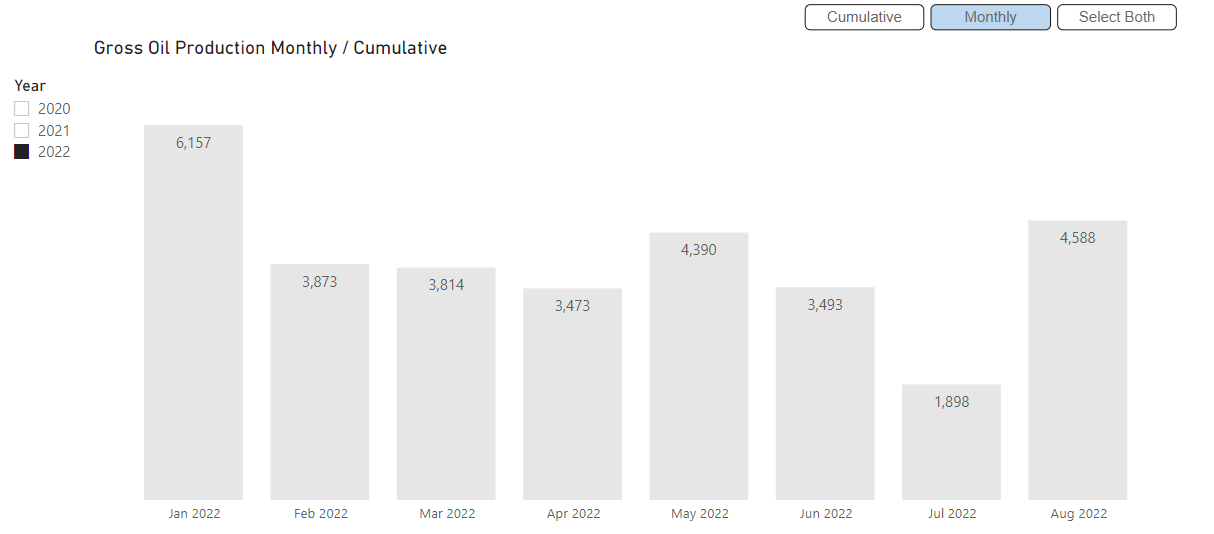
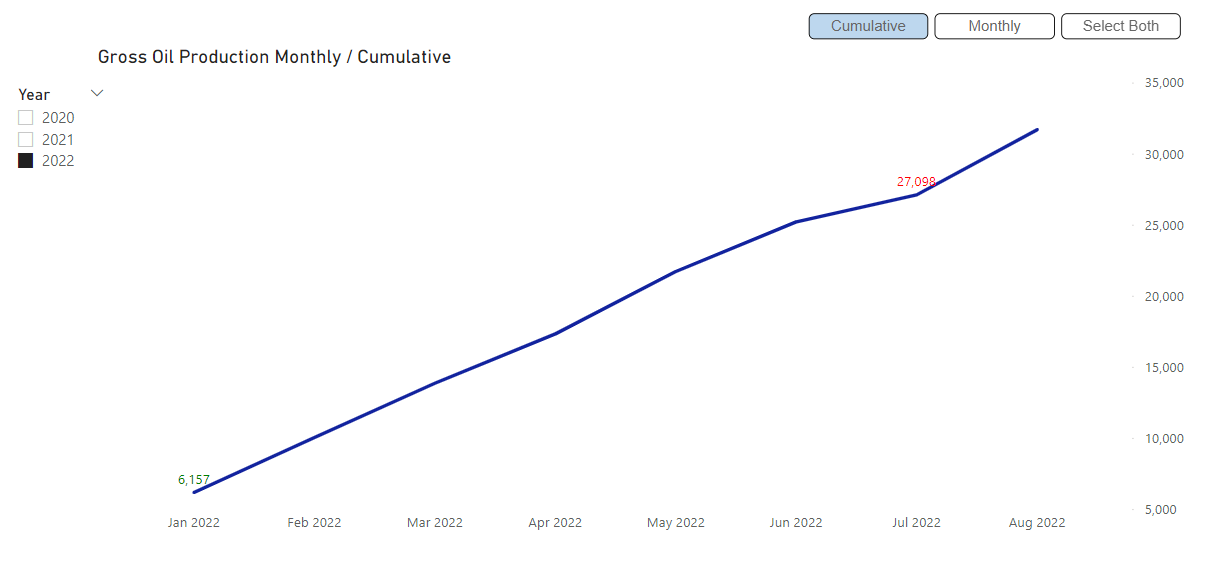
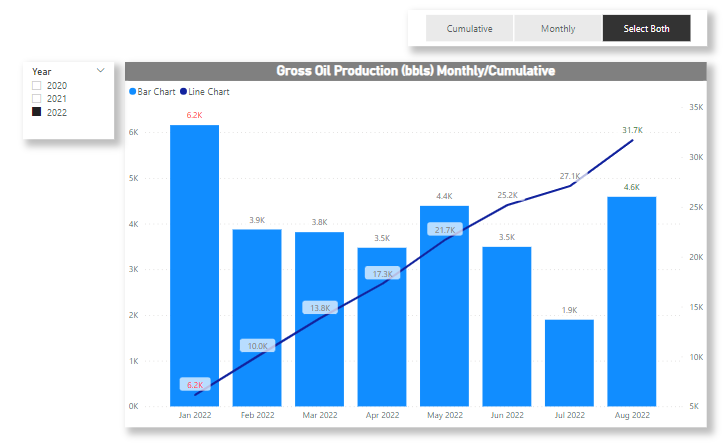
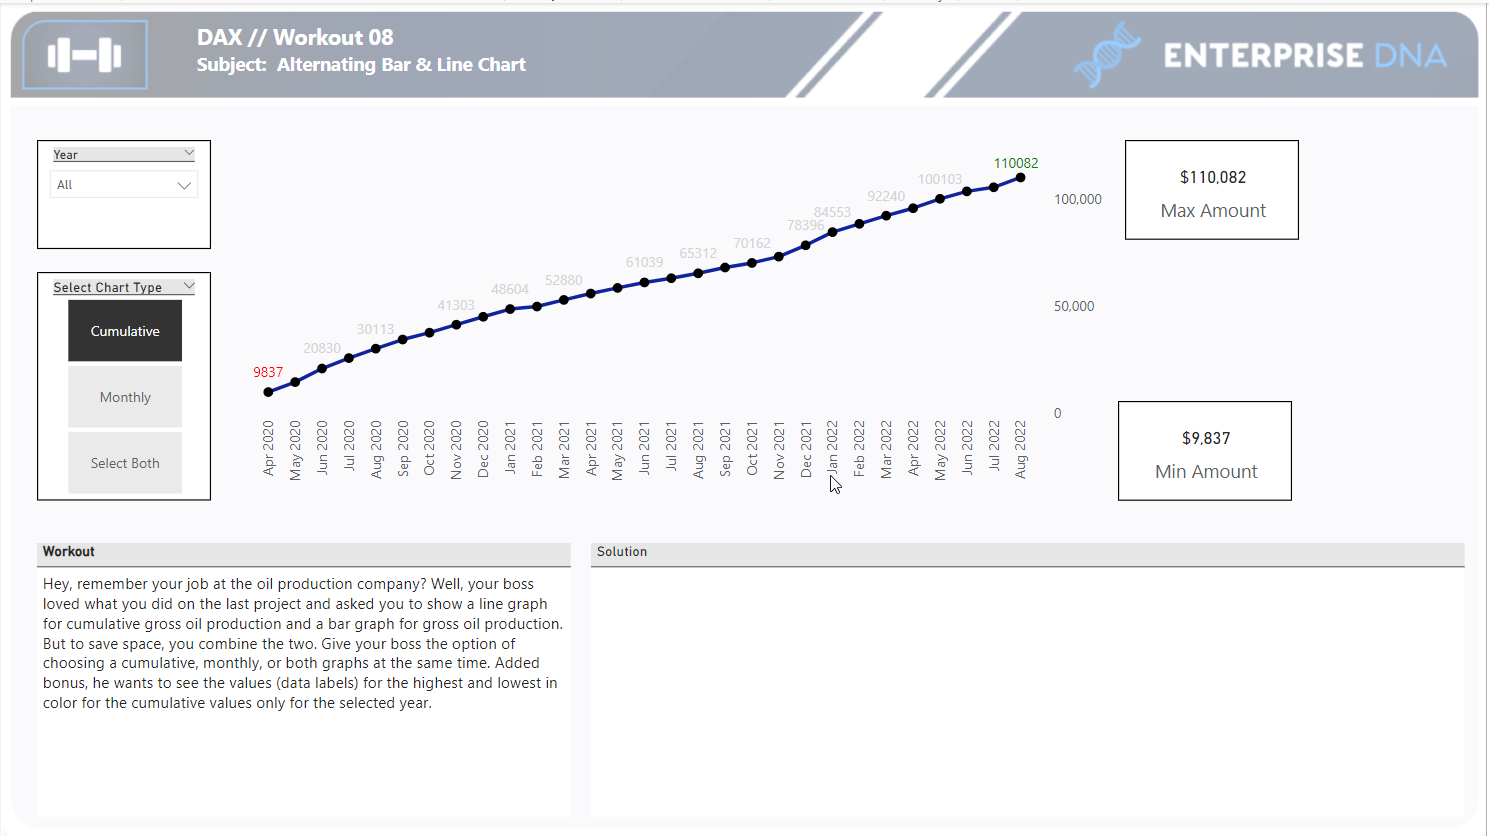
Hey, remember your job at the oil production company? Well, your boss loved what you did on the last project and asked you to show a line graph for cumulative gross oil production and a bar graph for gross oil production.
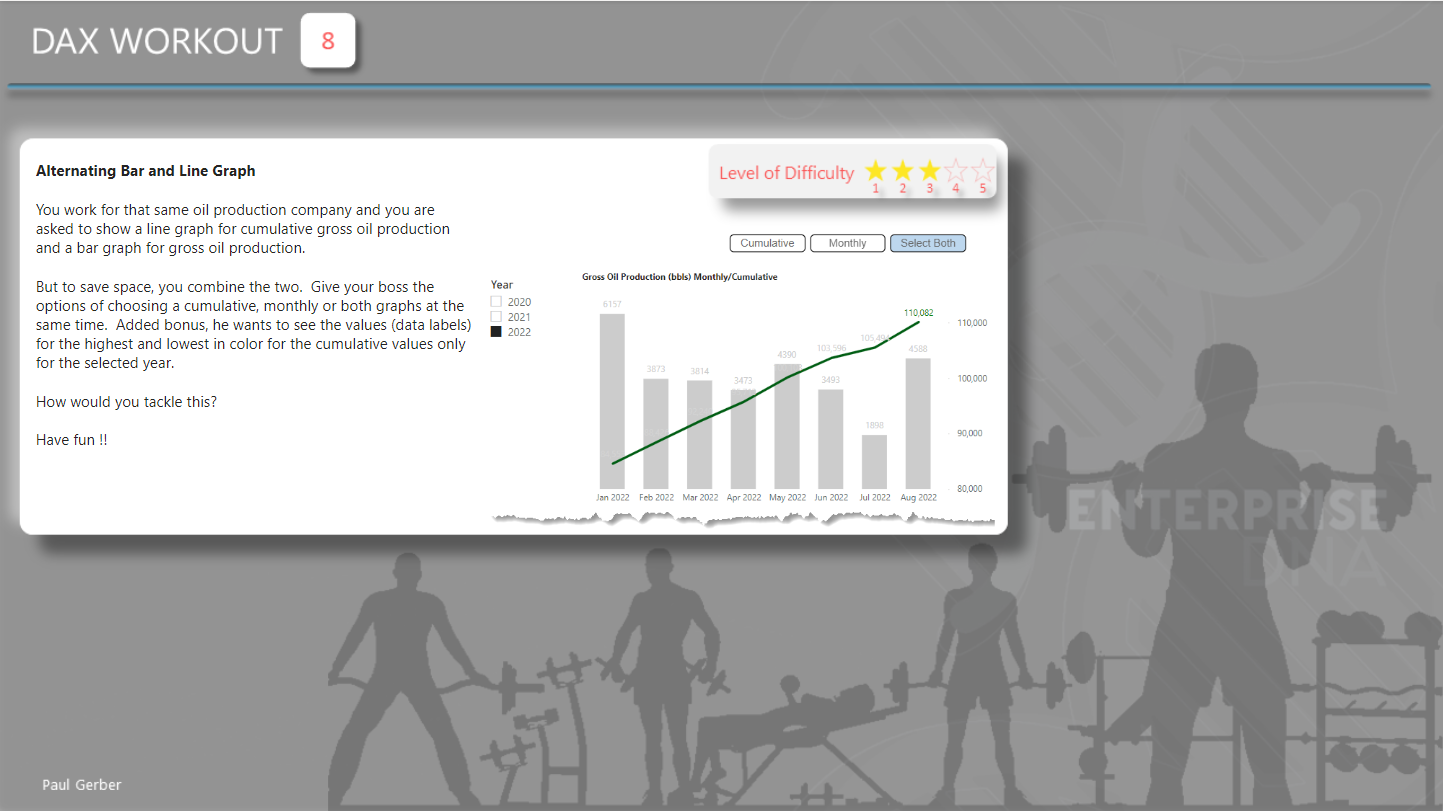
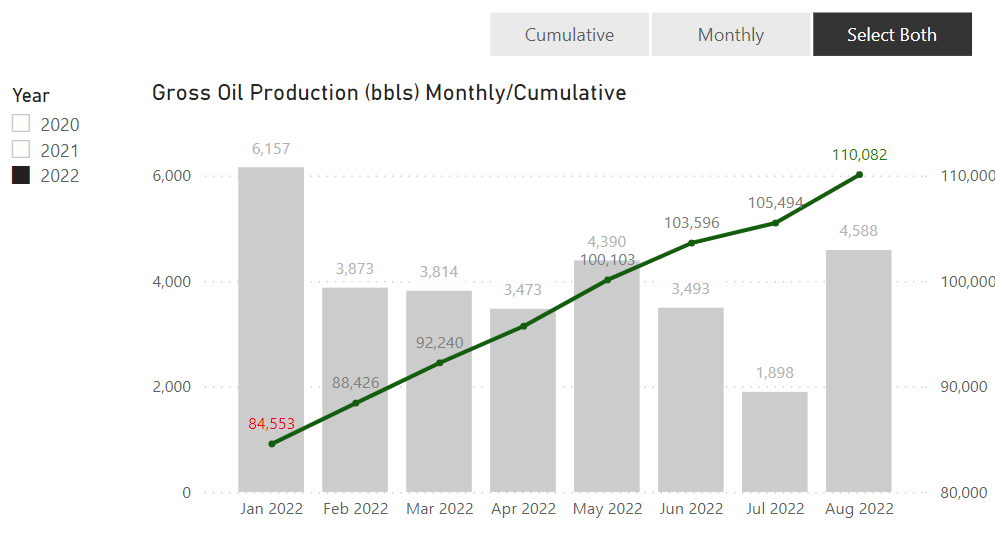
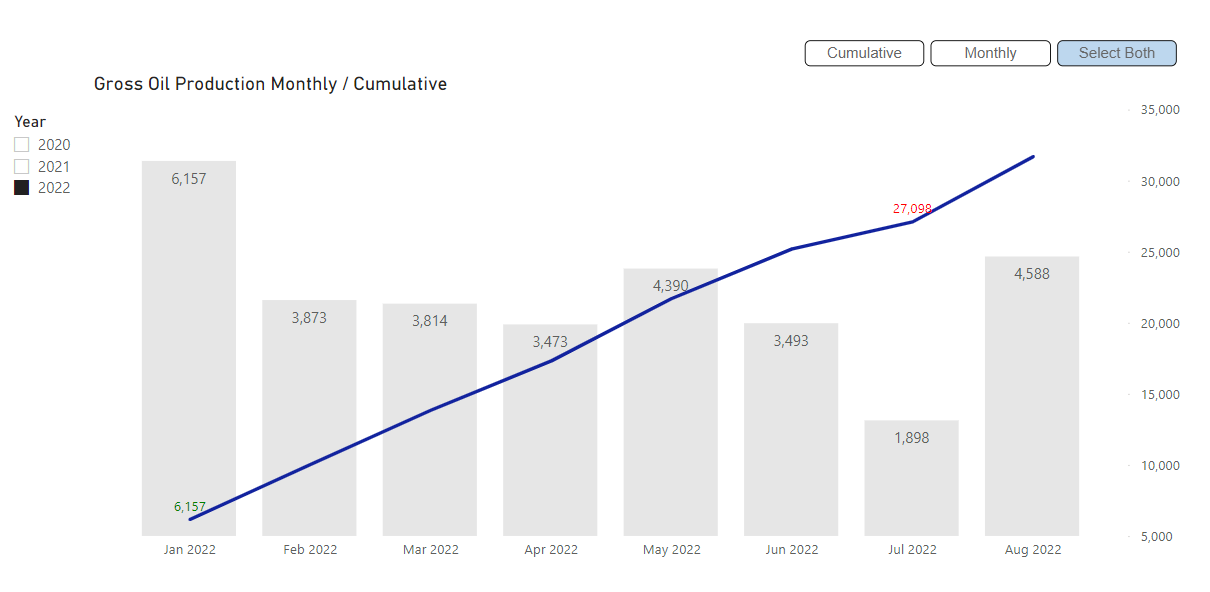
But to save space, you combine the two. Give your boss the option of choosing a cumulative, monthly, or both graphs at the same time. Added bonus, he wants to see the values (data labels) for the highest and lowest in color for the cumulative values only for the selected year.
How would you tackle this?
Have fun !!
Good luck and I am looking forward to the results.
Submission
Load the supplied data file into a new Power BI file, create your solution, and reply to this post. Upload a screenshot of your solution along with the DAX measure. Please format your DAX code and blur it or place it in a hidden section.
Period
DAX Workout No8 04132023.pbix (371.5 KB)
1 Like
There are a ton of different ways to approach this workout, so it will be interesting to see what people come up with. Here’s the first approach that came to my mind:
DAX Code:
Basic Measures
Oil Production Monthly = SUM ( 'Data Cleaned'[Oil Prod] )
Oil Production Cumulative =
CALCULATE (
    [Oil Production Monthly],
    WINDOW ( 1, ABS, 0, REL, ALL ( 'Date' ), ORDERBY ( 'Date'[Date], ASC ) )
)
Slicer Parameter Table
Slicer =
DATATABLE (
    "Button", STRING,
    {
        { "Cumulative" },
        { "Monthly" },
        { "Select Both" }
    }
)
Slicer-sensitive measures used in the chart
Bars =
IF (
    SELECTEDVALUE ( Slicer[Button] ) IN { "Monthly", "Select Both" },
    [Oil Production Monthly]
)
Line =
IF (
    SELECTEDVALUE ( Slicer[Button] ) IN { "Cumulative", "Select Both" },
    [Oil Production Cumulative]
)
Bonus color and title measures
Line Label Color =
VAR _Current = [Oil Production Cumulative]
VAR _Min =
    MINX (
        ALLSELECTED ( 'Date'[Month & Year], 'Date'[MonthnYear] ),
        [Oil Production Cumulative]
    )
VAR _Max =
    MAXX (
        ALLSELECTED ( 'Date'[Month & Year], 'Date'[MonthnYear] ),
        [Oil Production Cumulative]
    )
VAR _Color =
    SWITCH (
        TRUE(),
        _Current = _Max, "Green",
        _Current = _Min, "Red",
        "Gray"
    )
RETURN
    _Color
Title = "Gross Oil Production (bbls) " &
SWITCH (
    SELECTEDVALUE ( Slicer[Button] ),
    "Cumulative", "Cumulative",
    "Monthly", "Monthly",
    "Select Both", "Monthly/Cumulative"
)
DAX Workout No8 - Alexis Olson.pbix (378.8 KB)
7 Likes
@AlexisOlson this is fantastic. Great job. You’re right. So many different ways to do this. I have not used WINDOWS in a measure.
Thanks
Paul
1 Like
BrianJ
April 14, 2023, 10:30am
4
Paul,
Thanks - fun, well-designed challenge - lots of moving pieces to assemble in this one - measures, slicer switch, conditional format data labels, dynamic y axis, etc.
I ended up with a number of measures, so just dumped them all into a TE3 DAX Script below…
Click for DAX Script
---------------------------------
-- Measure: [CF Data Labels Line]
---------------------------------
MEASURE 'Key Measures'[CF Data Labels Line] =
    VAR __Upper = [Max MonthnYear]
    VAR __Lower = [Max MonthnYear]- 200

    VAR Result =
    IF(
        AND(
            SELECTEDVALUE( 'Date'[MonthnYear] ) <= __Upper,
             SELECTEDVALUE( 'Date'[MonthnYear] ) >= __Lower
        ),
        SWITCH( TRUE(),
            SELECTEDVALUE( 'Date'[MonthnYear]) = __Upper, "Darkgreen",
            SELECTEDVALUE( 'Date'[MonthnYear]) = __Lower, "Red",
            "Lightgray"
        ),
        "#FFFFFF00"
    )

    RETURN Result

---------------------------------------------
-- Measure: [Cumulative Gross Oil Production]
---------------------------------------------
MEASURE 'Key Measures'[Cumulative Gross Oil Production] =
    VAR __vTable_ =
    FILTER(
        ALL( 'Date'[Year], 'Date'[Month & Year], 'Date'[MonthnYear] ),
        'Date'[MonthnYear] <= MAX('Date'[MonthnYear] )
    )
    VAR __CumulTot =
    SUMX(
        __vTable_,
        [Total Gross Oil Production]
    )

    VAR __Result =
    IF(SELECTEDVALUE( 'Date'[MonthnYear] ) <= [Max MonthnYear], __CumulTot, BLANK())

    RETURN __Result
    FormatString = "\$#,0.###############;(\$#,0.###############);\$#,0.###############"

--------------------------------
-- Measure: [Harvest MonthnYear]
--------------------------------
MEASURE 'Key Measures'[Harvest MonthnYear] = SELECTEDVALUE( 'Date'[MonthnYear])
    FormatString = "0"

----------------------------
-- Measure: [Max MonthnYear]
----------------------------
MEASURE 'Key Measures'[Max MonthnYear] =
    VAR vTable =
        FILTER(
            ALLSELECTED( 'Date'[MonthnYear], 'Date'[Month & Year] ),
            [Total Gross Oil Production] > 0
        )

    VAR vTable2 =
        TOPN( 1, vTable, 'Date'[MonthnYear], DESC)


    VAR Result =
        MAXX(vTable2, 'Date'[MonthnYear])

    RETURN Result
    FormatString = "0"

------------------------
-- Measure: [Min Y Axis]
------------------------
MEASURE 'Key Measures'[Min Y Axis] =
    VAR MinCumul =
        MINX(
            ALLSELECTED('Date'[Month & Year] ),
            [Cumulative Gross Oil Production]
        )

    VAR Result =
    IF( MinCumul - 5000 < 0, MinCumul, MinCumul - 5000 )

    RETURN Result

---------------------------
-- Measure: [Switch Column]
---------------------------
MEASURE 'Key Measures'[Switch Column] =
    IF( SELECTEDVALUE( 'Chart Types'[Selections] ) = "Cumulative",
        BLANK(),
        [Total Gross Oil Production]
    )

-------------------------
-- Measure: [Switch Line]
-------------------------
MEASURE 'Key Measures'[Switch Line] =
    IF( SELECTEDVALUE( 'Chart Types'[Selections] ) = "Monthly",
        BLANK(),
        [Cumulative Gross Oil Production]
    )
    FormatString = "0"

----------------------------------------
-- Measure: [Total Gross Oil Production]
----------------------------------------
MEASURE 'Key Measures'[Total Gross Oil Production] = SUM( 'Data Cleaned'[Oil Prod])
    FormatString = "#,0.00"
DAX Workout 008 - Brian Julius Solution.pbix (593.5 KB)
2 Likes
KimC
April 16, 2023, 1:30pm
5
Hi Paul,
Here is my solution:
Dax:
Summary
DAX Workout No8 Kim Cook.pbix (481.0 KB)
4 Likes
Awesome job @KimC . Glad you liked it.
1 Like
Thanks for a great workout … went through everyone work and really learned a lot.
Donn Clark (DEC)
3 Likes
Anurag
April 25, 2023, 9:57am
8
Hi @Paul.Gerber ,
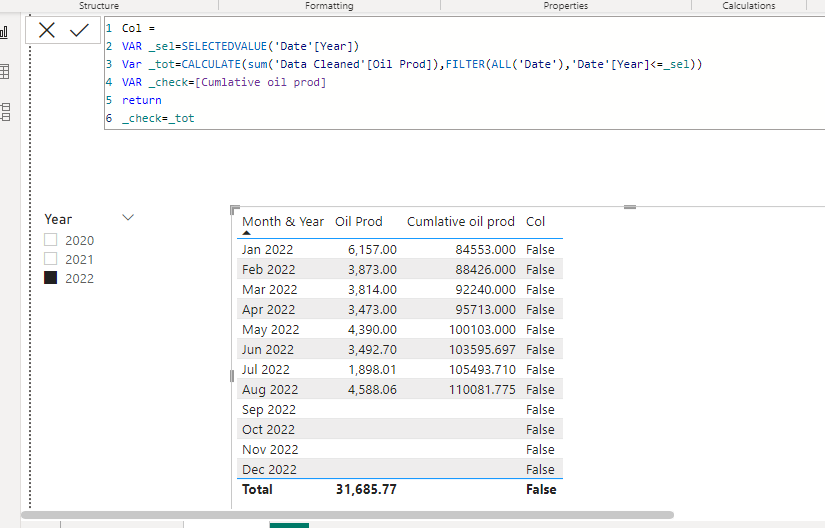
Thanks for the Workout challenge .I need little help on this i am not able to figure out what i am doing wrong while creating measure for colorings the data label.
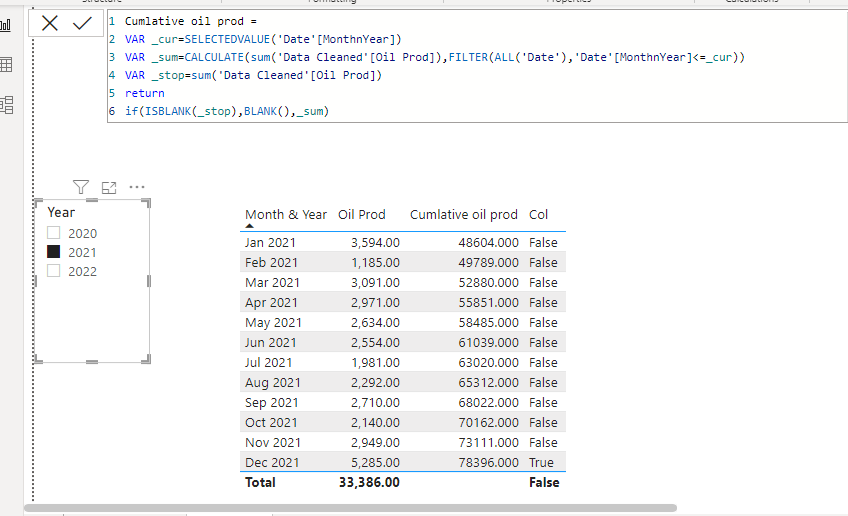
It is not giving true for last entery but same measure working fine for 2021 and 2020
There is another way also but i want to figure out why its not giving right result for the 2022
DAX Workout No8 04132023.pbix (378.0 KB)
2 Likes
@Anurag thanks for doing the workout. The data ends at August 2022 and not at the end of the year like in 2021 and 2020. Check your date table? I’ll look and will post my solution today.
All the best
Paul
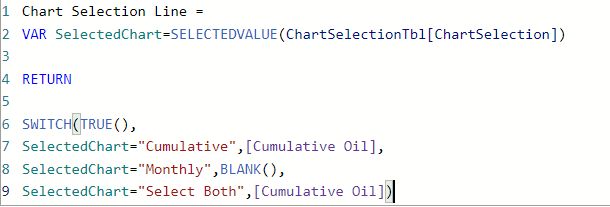
Here is my submission.Went through everyone’s work and learned a lot. Thats a great exercise.
DAX Measures
This text will be hidden
Gross Oil Production =
SUM( 'Data Cleaned'[Oil Prod] )
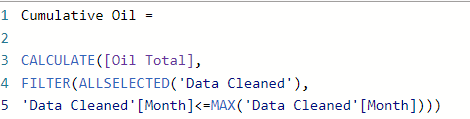
Cumulative Gross Oil Production =
CALCULATE(
[Gross Oil Production],
FILTER(
ALLSELECTED( 'Data Cleaned' ),
'Data Cleaned'[Month] <= MAX( 'Data Cleaned'[Month] )
)
)
Bar Chart =
IF(
SELECTEDVALUE( 'Choose Type'[Type] ) IN { "Select Both", "Monthly" },
[Gross Oil Production]
)
Line Chart =
IF(
SELECTEDVALUE( 'Choose Type'[Type] ) IN { "Cumulative", "Select Both" },
[Cumulative Gross Oil Production]
)
MinVal =
MINX(
ALLSELECTED( 'Date' ),
[Cumulative Gross Oil Production]
)
MaxVal =
MAXX(
ALLSELECTED( 'Data Cleaned' ),
[Cumulative Gross Oil Production]
)
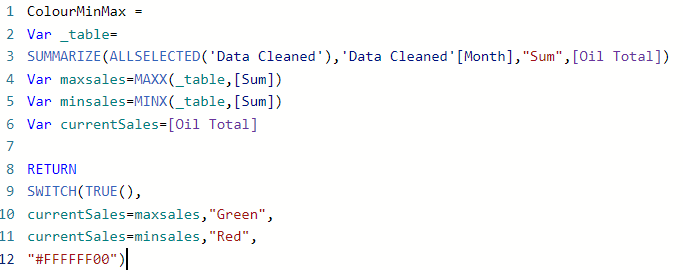
Label Color =
SWITCH(
TRUE(),
[Cumulative Gross Oil Production] = [MaxVal],
"Green", [Cumulative Gross Oil Production] = [MinVal],
"Red", "Gray"
)
Dynamic Label =
VAR _text = "Gross Oil Production( bbls )"
RETURN
SWITCH(
TRUE(),
SELECTEDVALUE( 'Choose Type'[Type] ) = "Select Both",
_text & " Monthly/Cumulative",
SELECTEDVALUE( 'Choose Type'[Type] ) = "Cumulative",
_text & " Cumulative",
SELECTEDVALUE( 'Choose Type'[Type] ) = "Monthly", _text & " Monthly"
)
1 Like