DAX Workout 002 - Highlight Color Bars

Welcome to Workout #2.

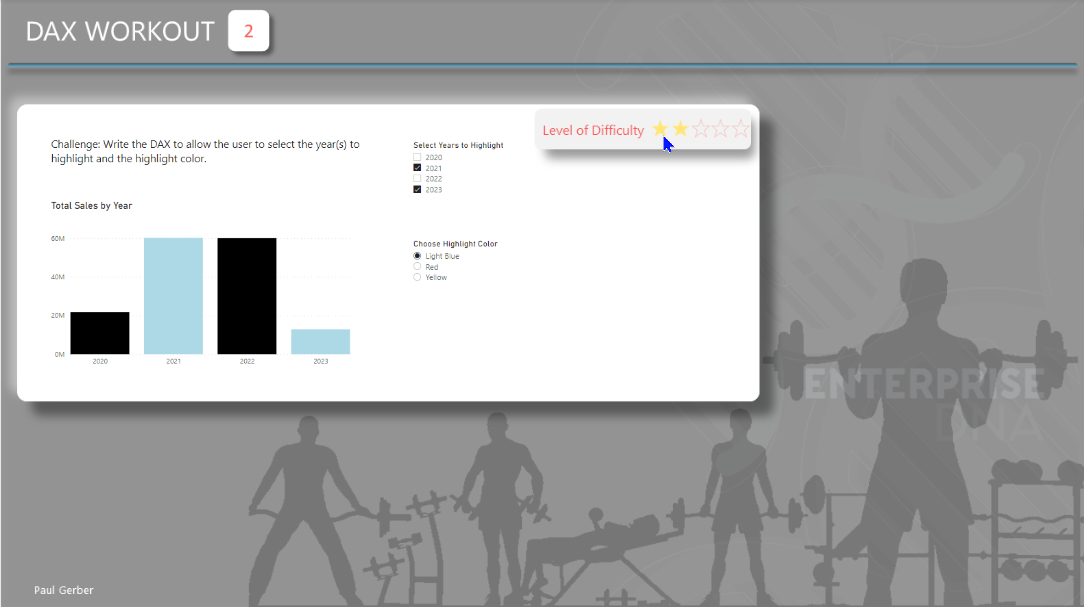
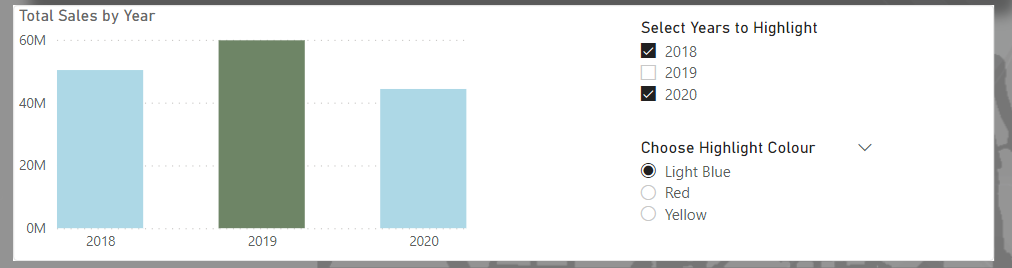
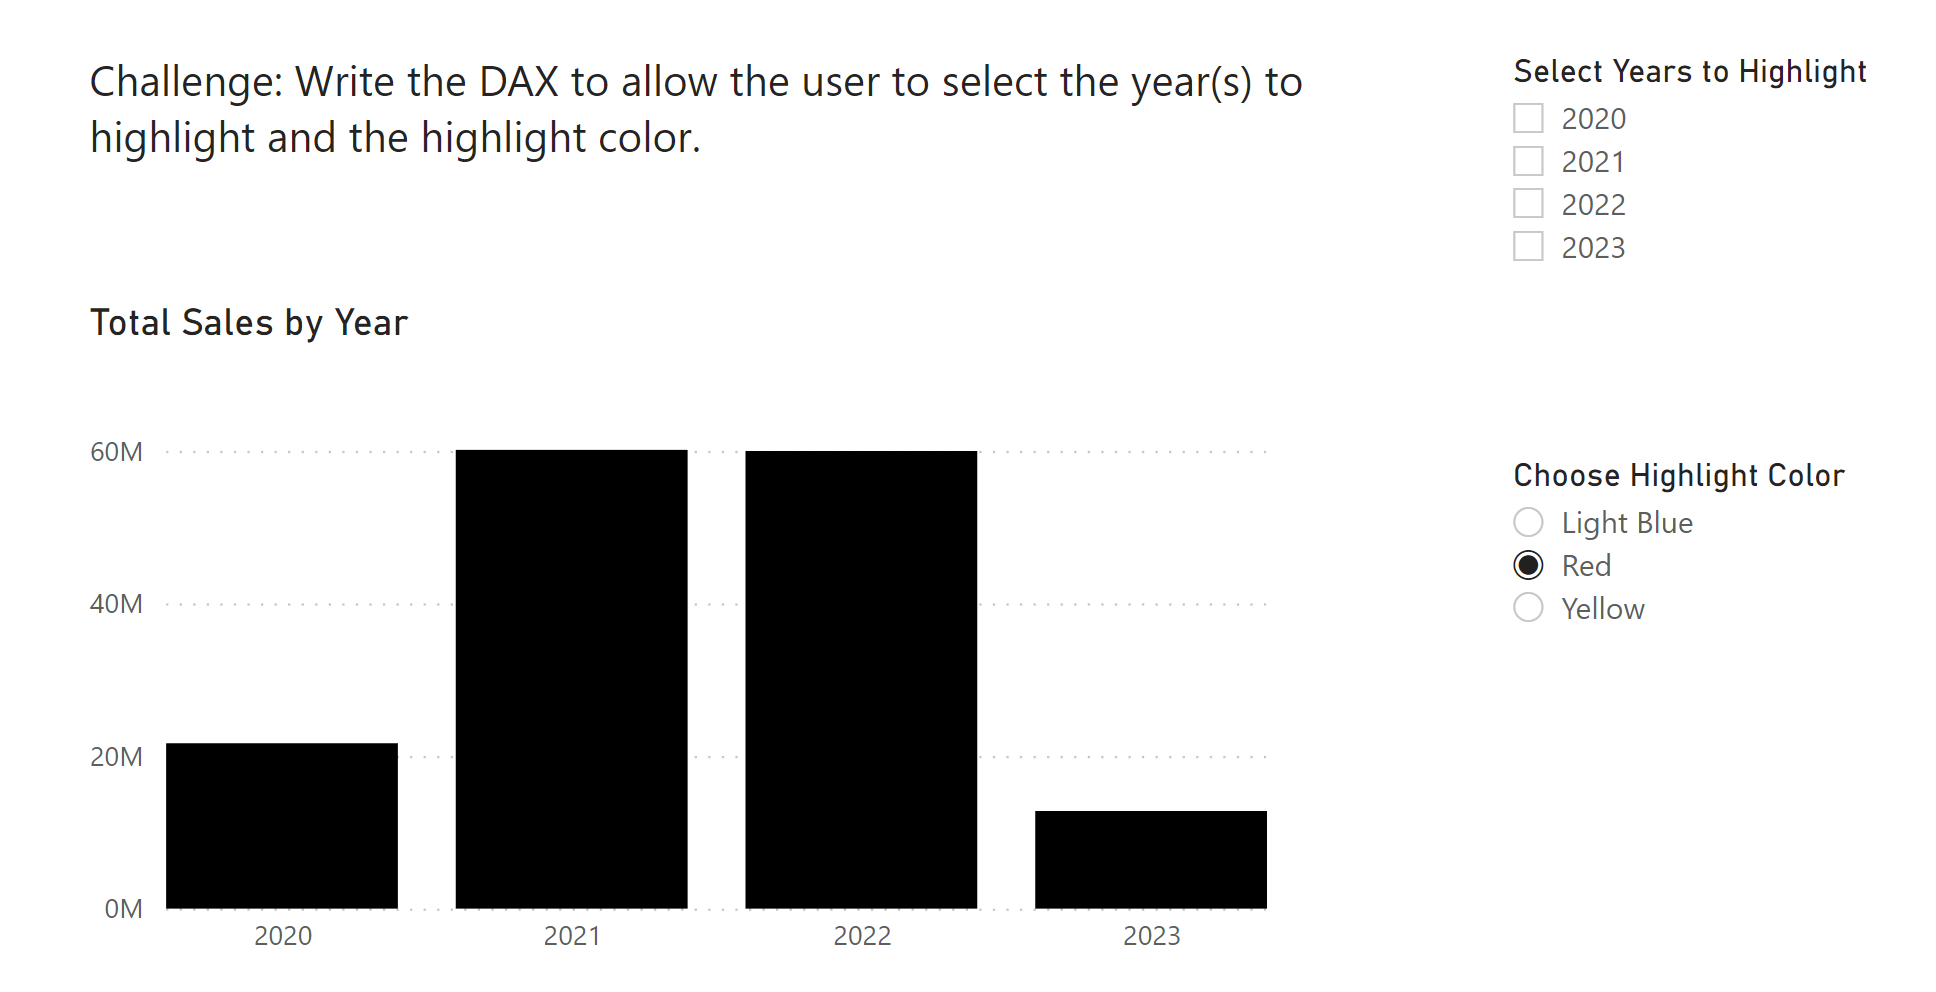
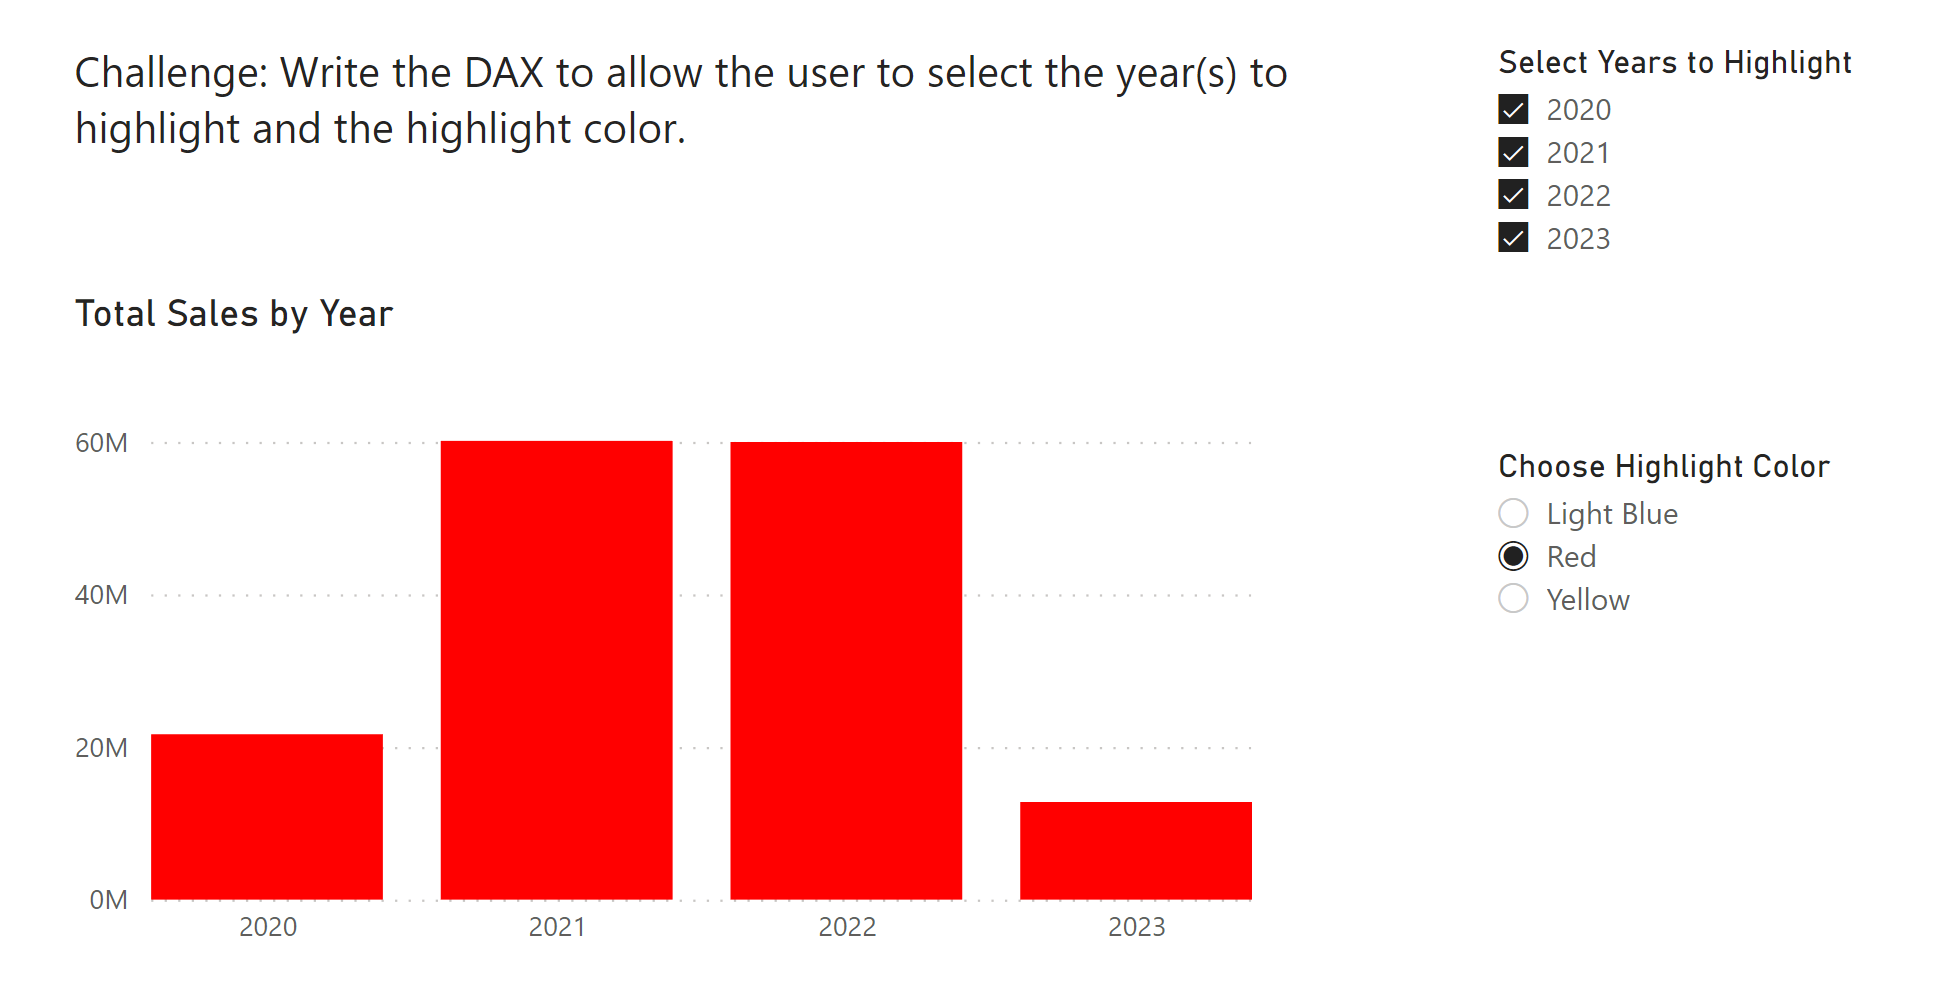
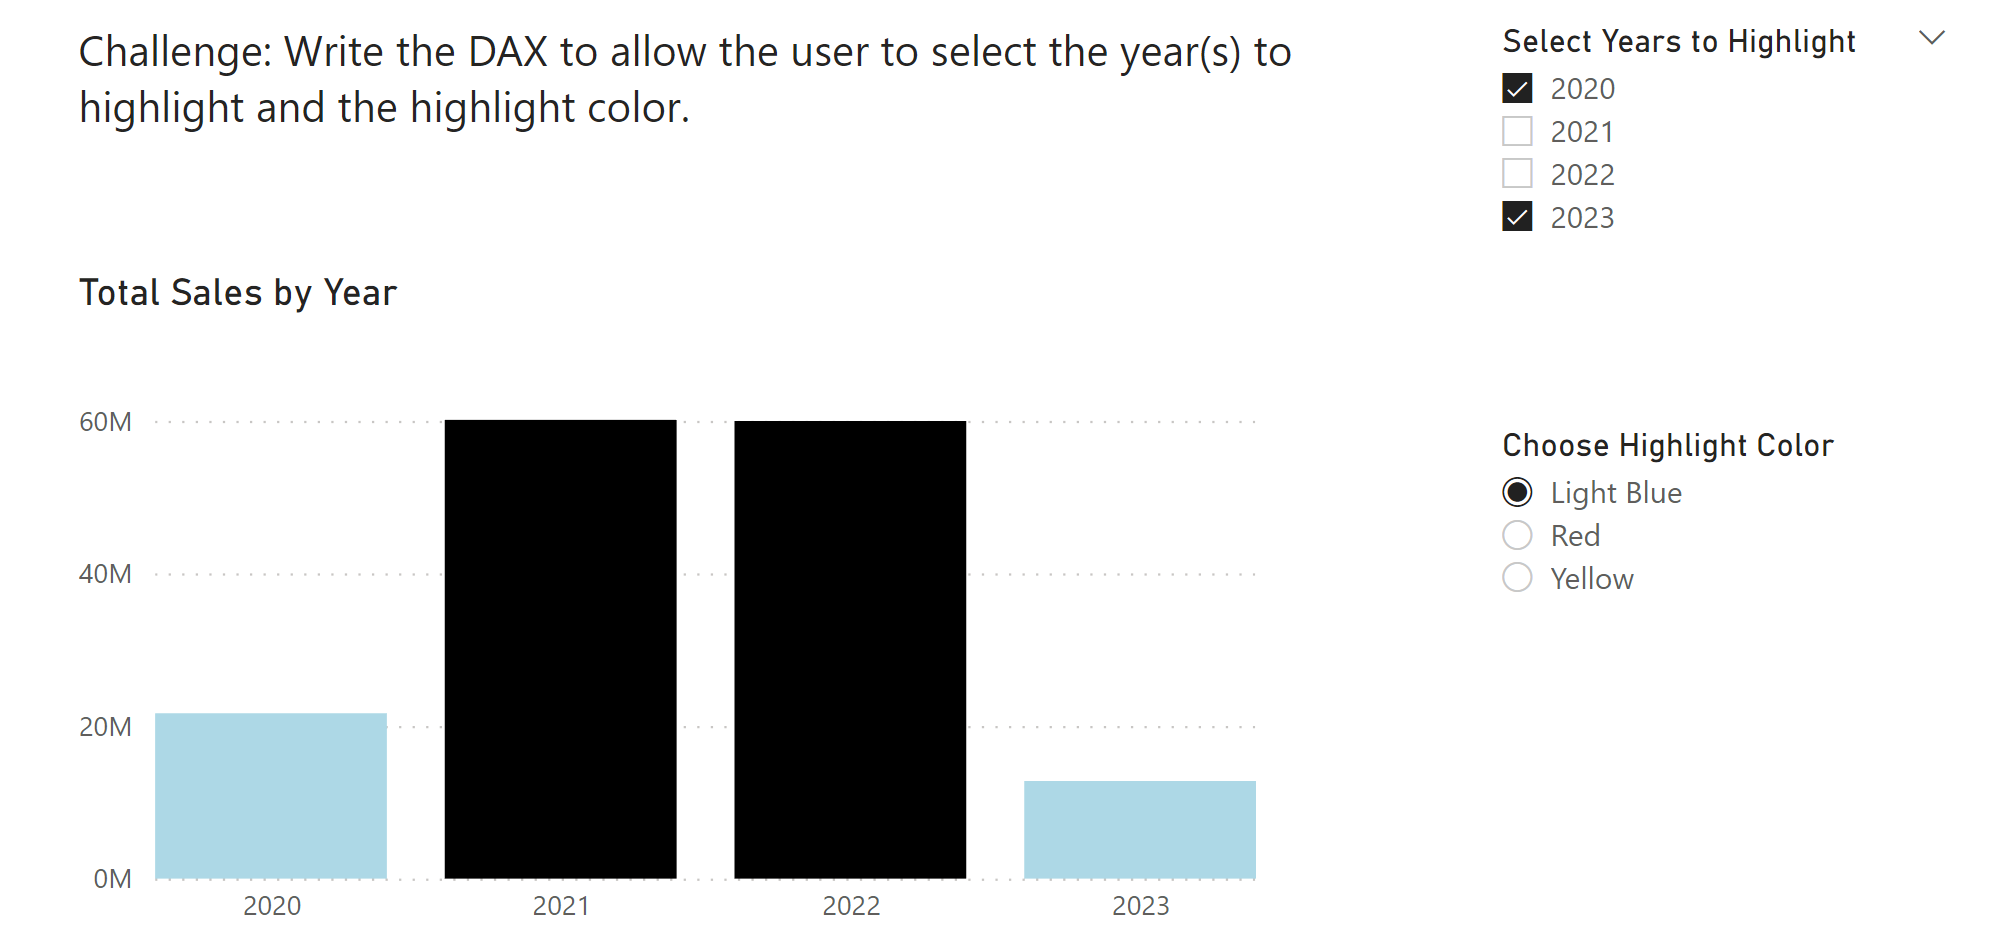
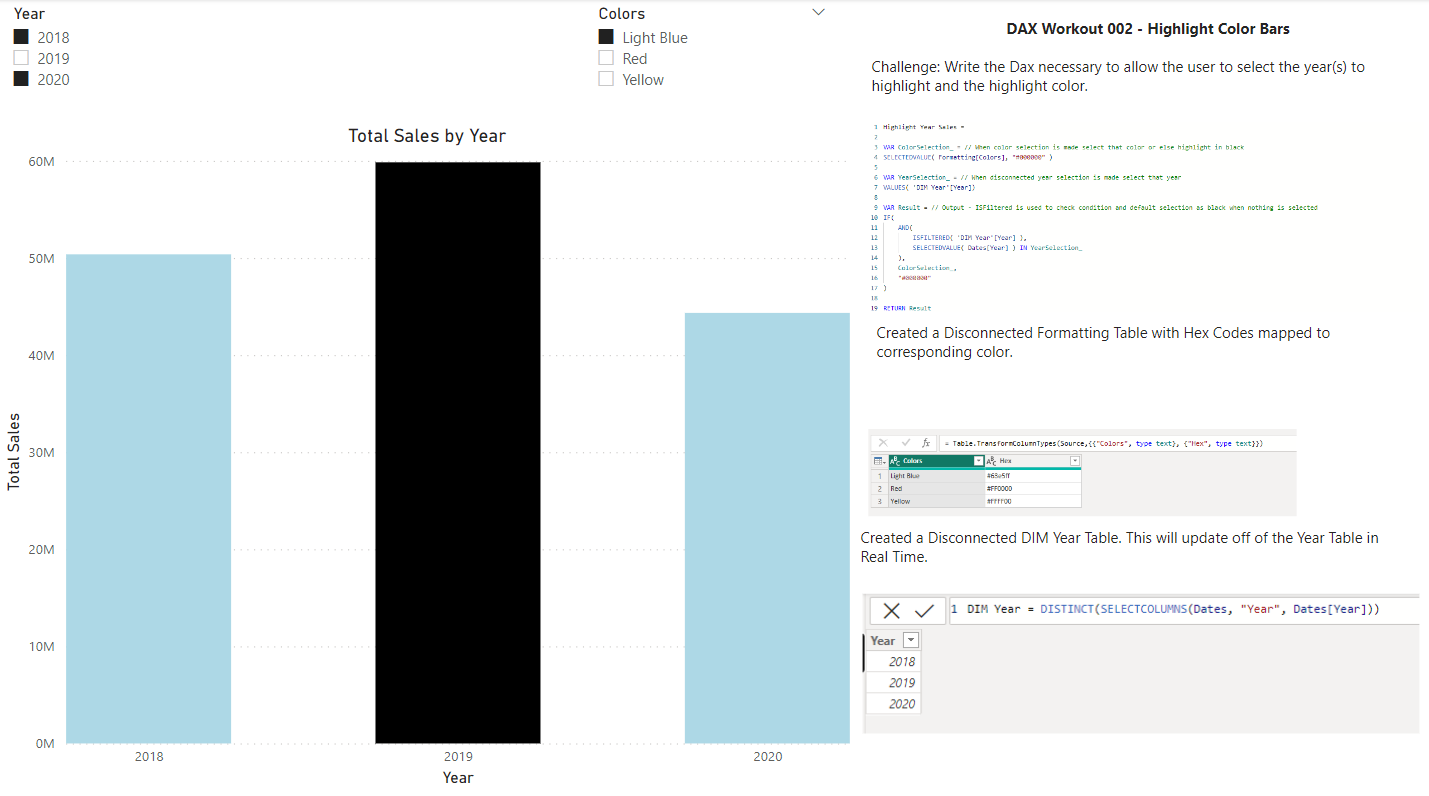
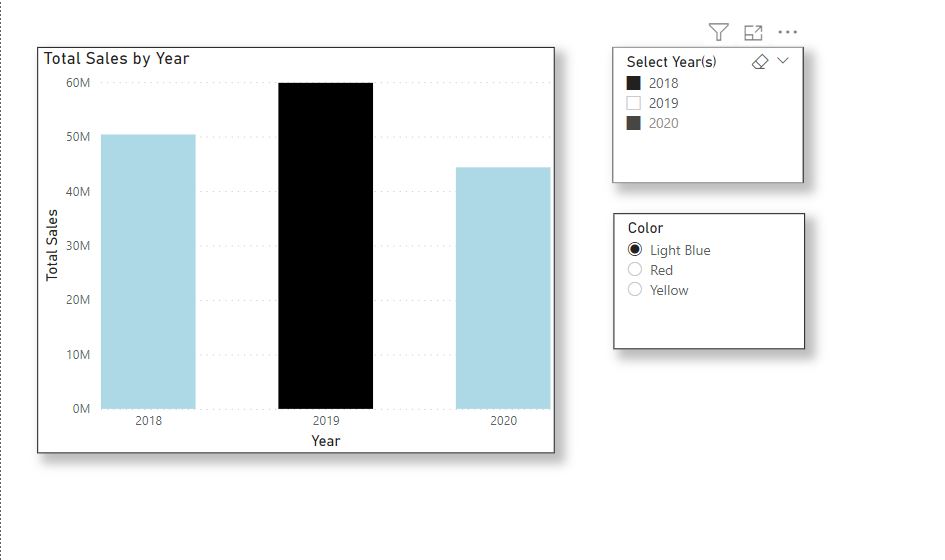
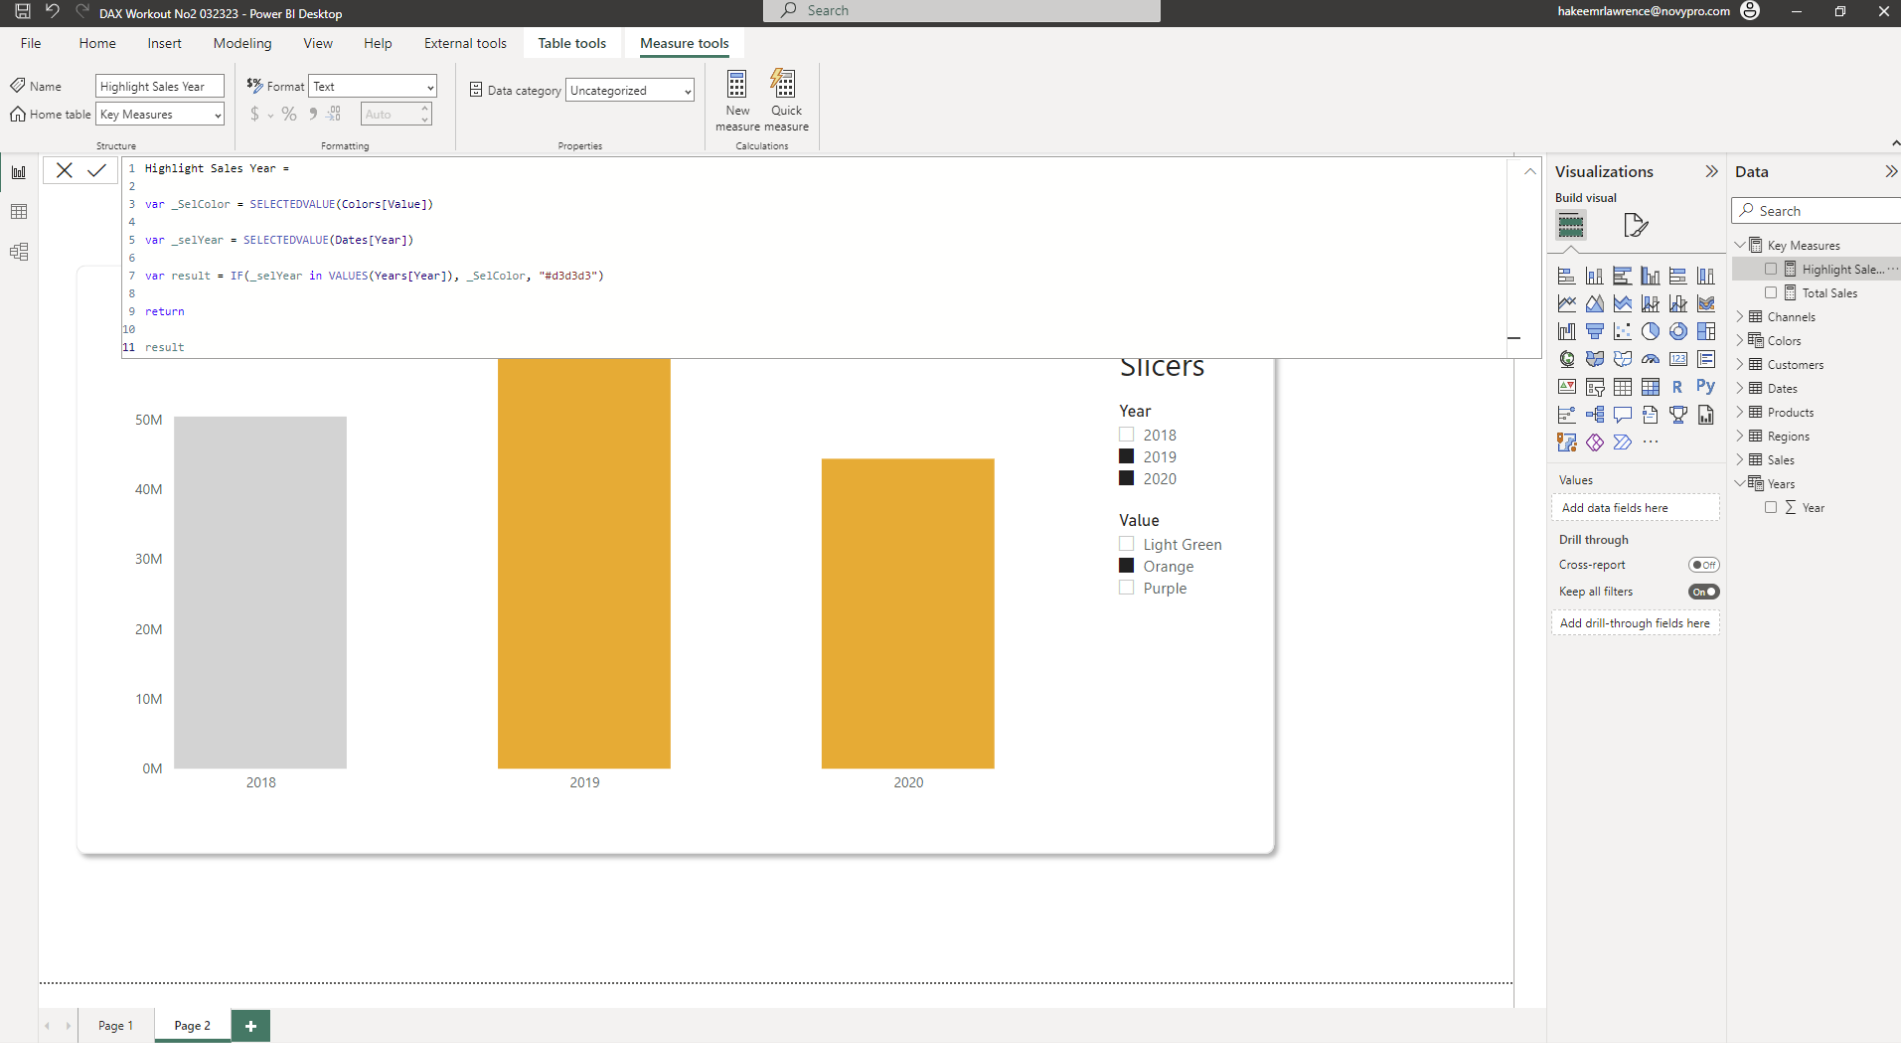
For this workout, you are asked to create the DAX necessary to allow the user to select the year(s) to highlight in the column chart as well as select the color of that highlighting. You can modify/augment the data model provided if needed.

Submission

Load the supplied data file into a new Power BI file, create your solution, and reply to this post. Upload a screenshot of your solution along with the DAX measure. Please format your DAX code and blur it or place it in a hidden section.

Period
This workout will be released on Thursday, March 23, 2023, and the author’s solution will be posted on Sunday, March 26, 2023.

DAX Workout No2 032323.pbix (502.2 KB)

4 Likes

So…

I created a couple of disconnected tables

image

image

Created this measure

Placed the measure in the column conditional formatting

And it allowed me to do this…

DAX Workout No2 032323 DJ.pbix (505.1 KB)

3 Likes

Hi

My Submission for workout

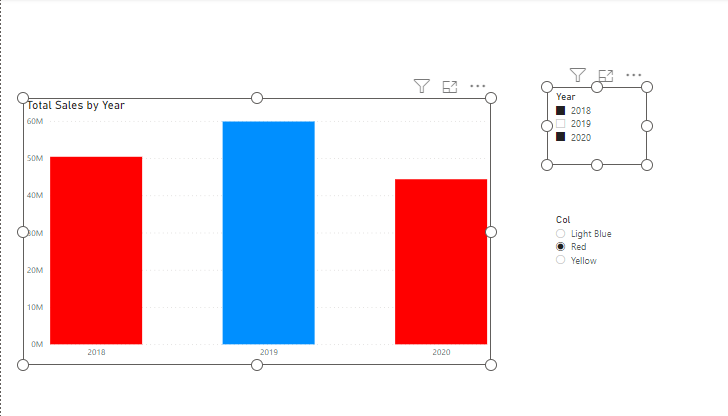
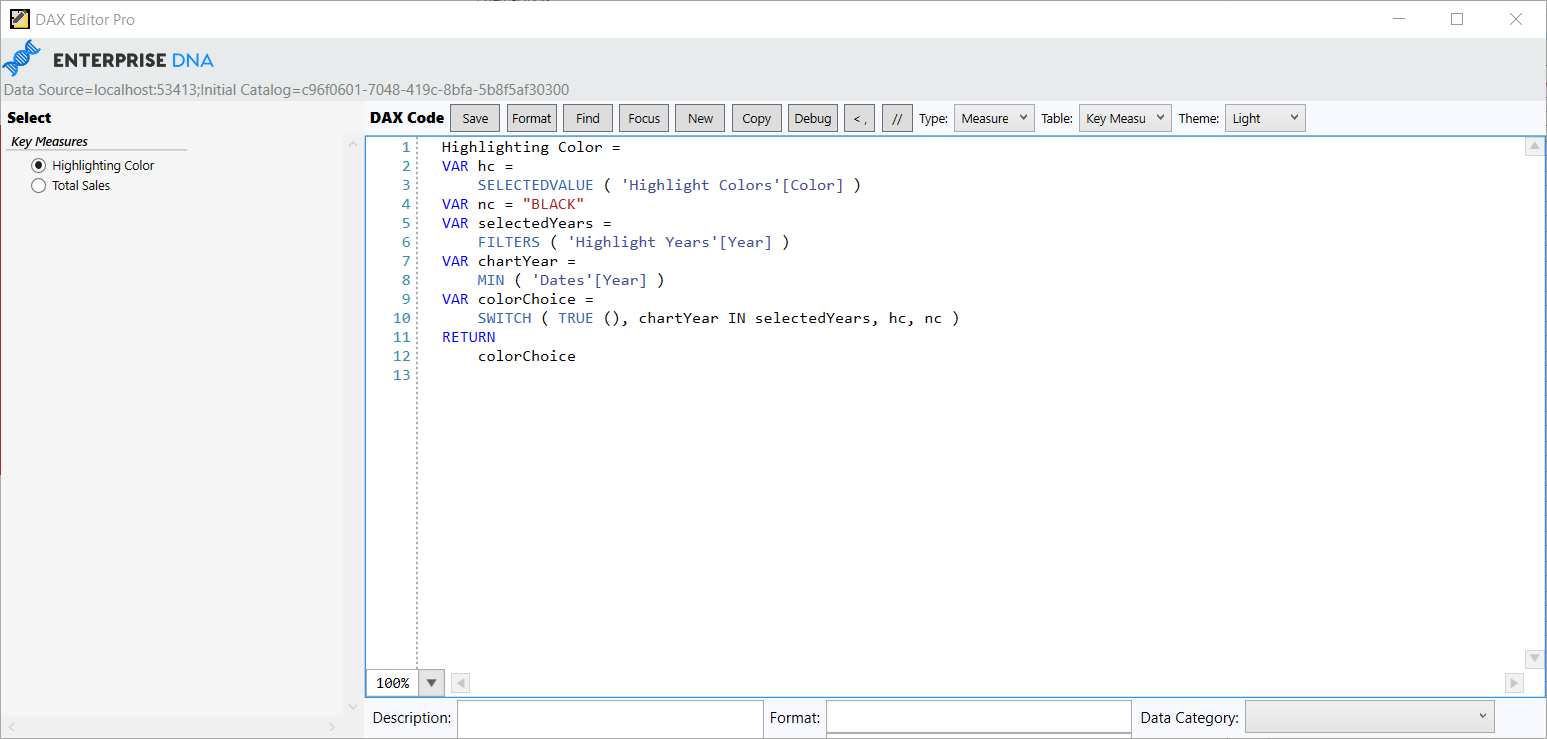
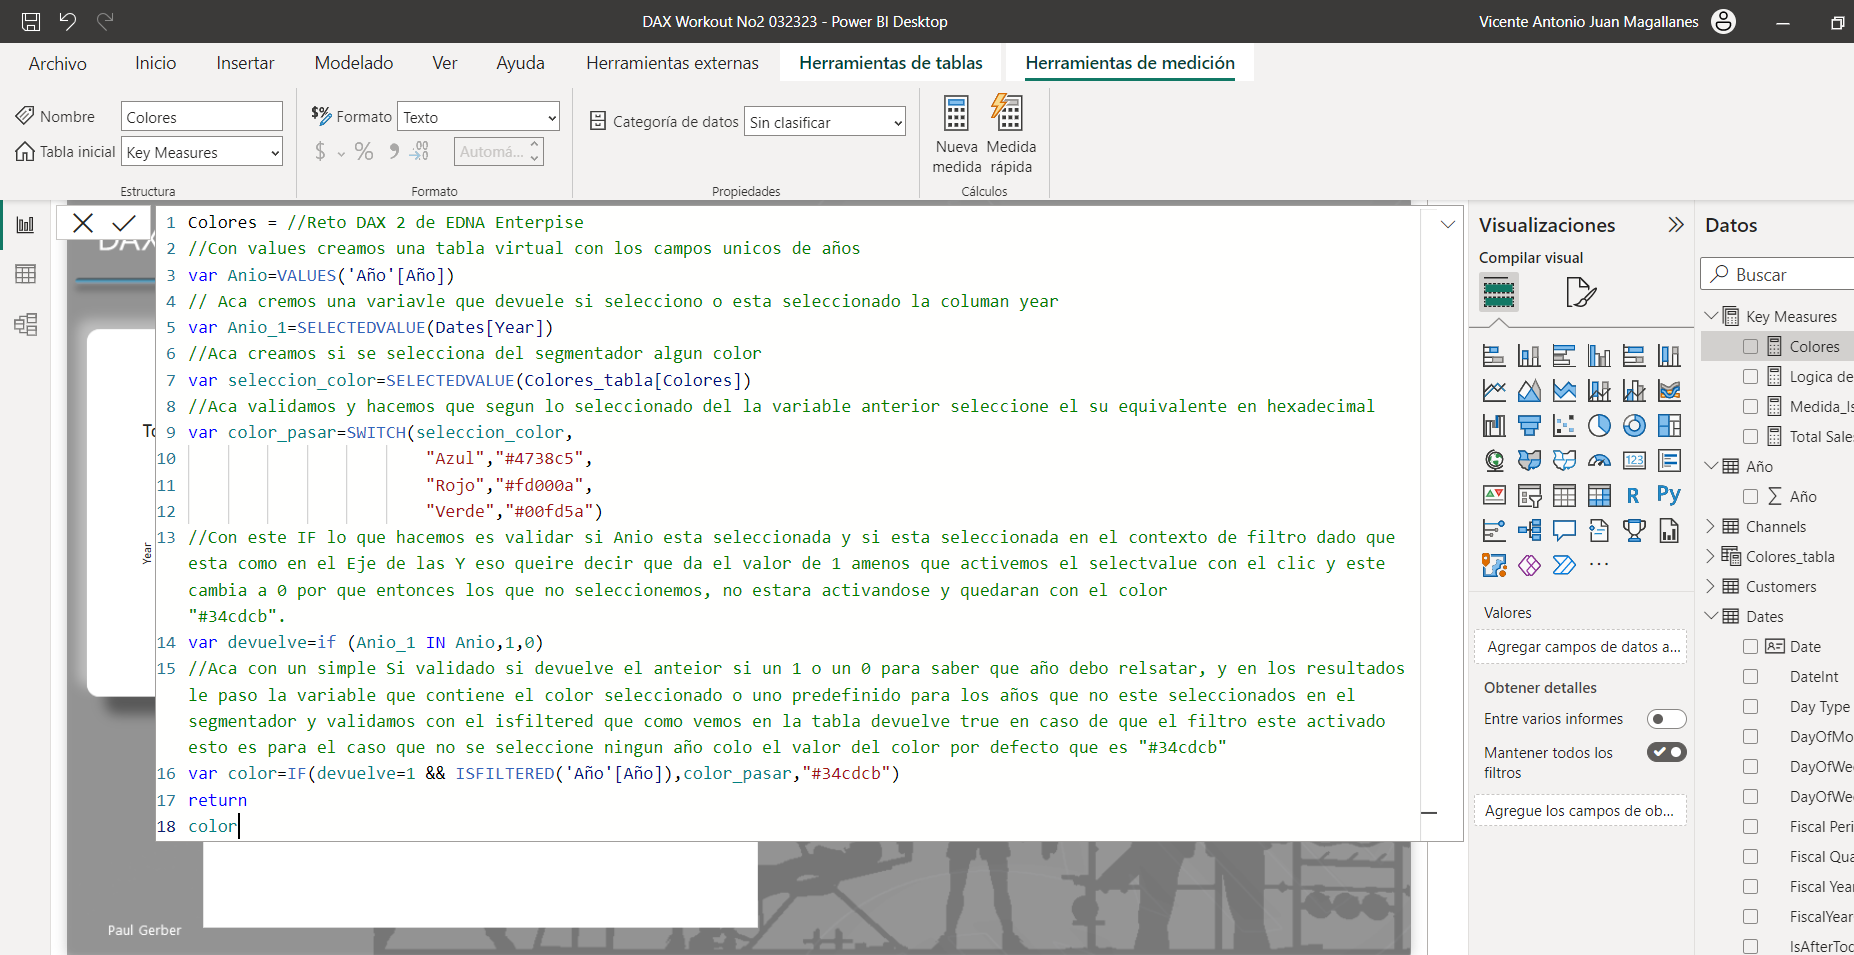
I created the two disconnected table for the filter year and col and build my measure around that as shown in the below image and with the help of that i am able to archive the answer

Col = 
VAr sel_col= SELECTEDVALUE('Col slicer'[Col])
VAR Sel_year= SELECTEDVALUE(Dates[Year])
VAr tb= VALUES('Date Slicer'[Year])
VAR con = if (Sel_year in tb ,sel_col)
return
con

DAX Workout No2 032323.pbix (505.5 KB)

3 Likes

@Paul.Gerber,

Fun problem. Here’s my solution below…

Summary

I created two disconnected tables in Power Query, one for Years referenced off of the Dates table, and one for Colors, created through via Enter Data.

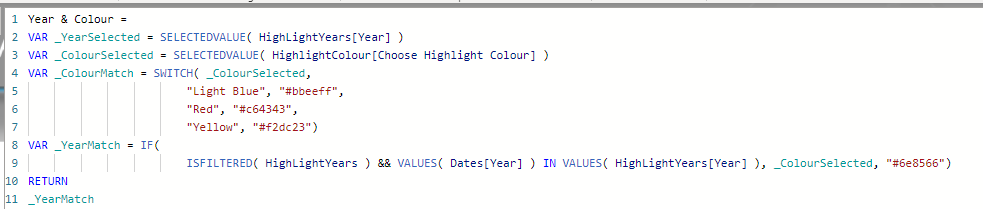
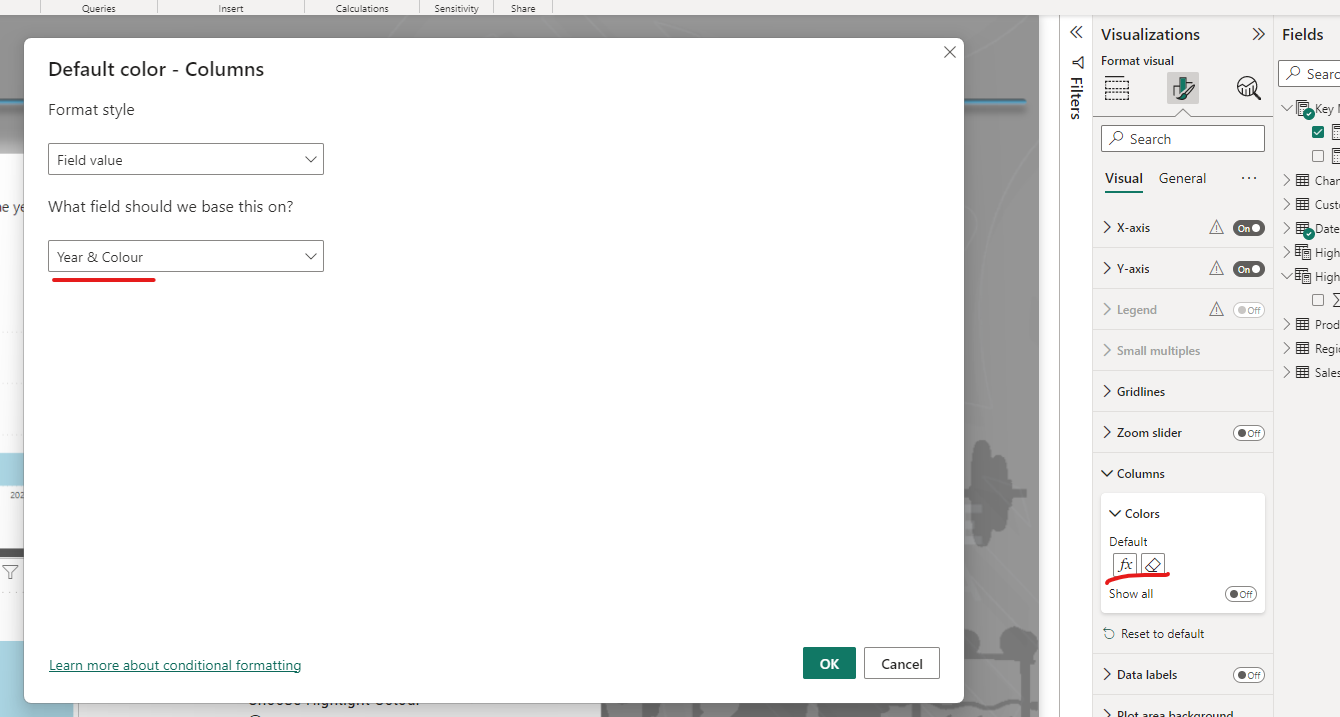
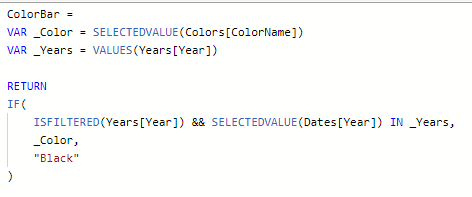
Then used the following measure to set the conditional formatting for the columns in the chart:

CF Color = 

VAR SelColor =
SELECTEDVALUE( Colors[Color], "Black" )

VAR SelYrs =
VALUES( 'Disconn Years'[Year] )

VAR Result =
IF(
    AND( 
        ISFILTERED( 'Disconn Years'[Year] ),
        SELECTEDVALUE( Dates[Year] ) IN SelYrs
    ), 
    SelColor, 
    "Black"
)

RETURN Result

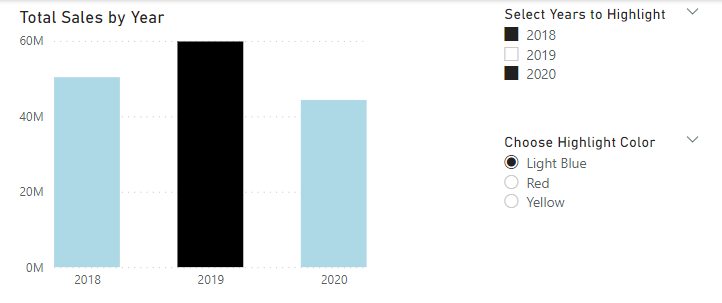
The key here is deciding what you want the slicer/visual to do when no years are selected? The default behavior is to treat that the same as selecting all the years. However, I wanted the visual to be all black when no years were selected, thus the additional ISFILTERED( ) function in my DAX measure…

5 Likes

Awesome @BrianJ That’s a good point. When none is selected make it black. I like making mine grey then the selected a color. It stands out more to me.

2 Likes

@Anurag thanks for the submission. That’s a great approach.

1 Like

Here’s my cut at it.
DAX Workout No2 032323-dh.pbix (504.7 KB)

3 Likes

Here is my Solution–

// DAX Measure //
Highlight Year Sales =

VAR _Selectedyear = SELECTEDVALUE(Dates[Year])

VAR _SelectedColor = SELECTEDVALUE(‘DIM Color’[Value])

VAR _Result = IF(_Selectedyear IN VALUES(‘DIM Year’[Year]), _SelectedColor, “Grey”)

Return
_Result

3 Likes
3 Likes

@JordanSchnurman Awesome job! Works great! Thanks for doing the challenge.

1 Like

It’s interesting looking at the query plans for the measures.

I’m using a MIN to get my chart year and Brian is using a SELECTEDVALUE and they both issue a “MinMaxColumnPositionCallback” in their queries.

This is definitely going to help me with query tuning.

4 Likes

Hi, here is my solution:

DAX Formula

image

2 Likes

Jordan,

Nice job! Thanks for participating. One thing that may make your life a bit easier is to use named colors instead of hex codes.

Here’s a cheatsheet I prepared a while back of the nearly 150 named colors that Power BI recognizes.

  • Brian

Brian Julius Named Colors Cheatsheet.pdf (86.4 KB)

9 Likes

Acá comparto mi solución , muy contento de participar en los retos DAX y espero venga muchos


2 Likes

I’m envious of your documentation discipline.

4 Likes

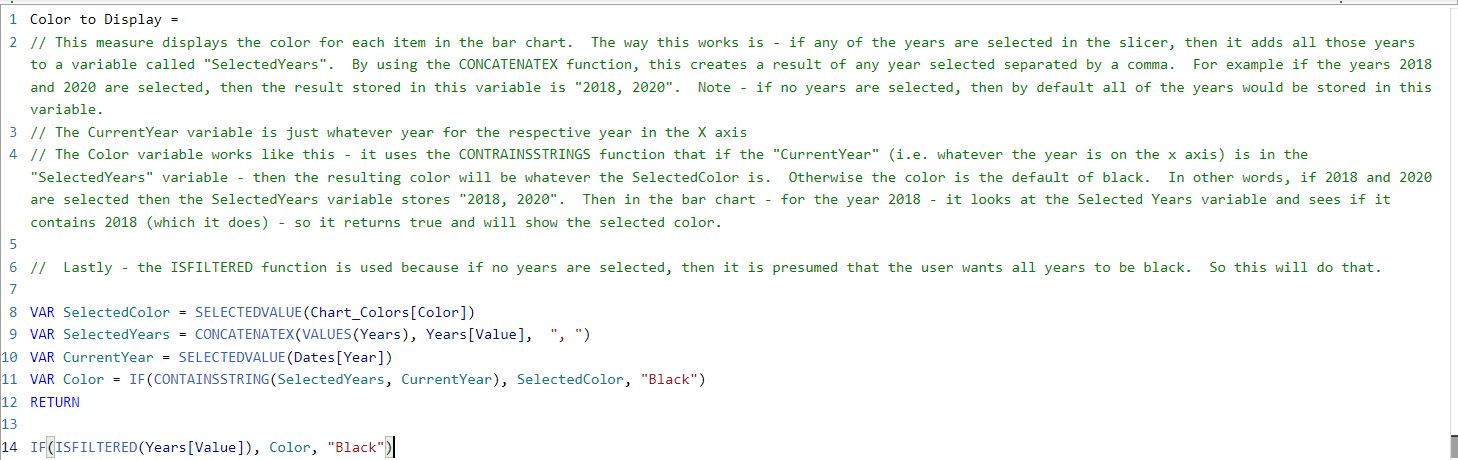
@Paul.Gerber - great workout. Here was my approach:

Summary

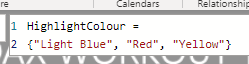
First, I created a simple table with one column that has the three colors. I just used the names of the colors versus the hex codes. This table is used as the slicer for the user to choose which color. The formatting for this slicer was set to only allow one selection.

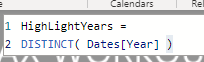
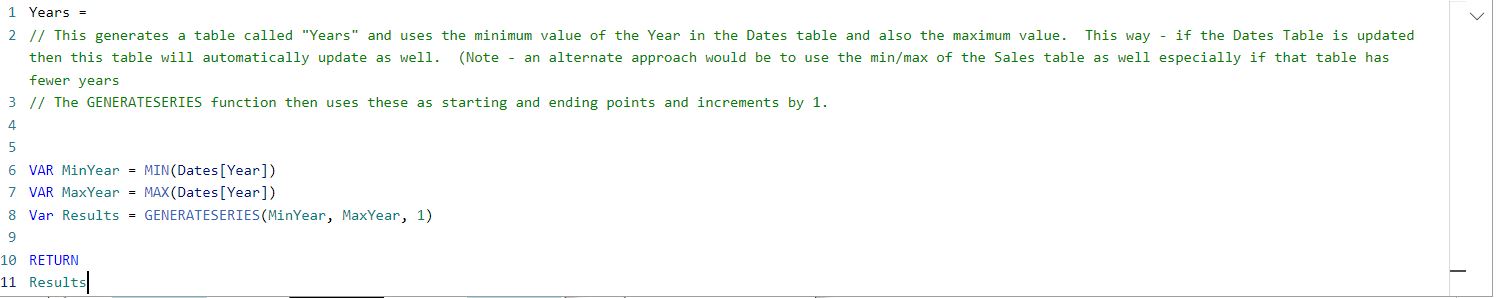
Second, I created a table to generate the years to be used as another slicer. For this table, I use some DAX to dynamically create the table on the presumption that it would be possible for more dates to arise in future. So the DAX code for this was:

Finally - the main color measure was created that is used for the Colors property in the visual itself. The measure is:

With the resulting output:

5 Likes

Brian- as you stated on Helen Wall post on LinkedIn the greatest honor you could do is to laminate :grin:

This one is worthy of lamination as well

3 Likes

@jplouw ,

Glad you found it so helpful. I actually have laminated this one, and use it all the time.

Note: laminator visible in the background (blue tray). :grinning:

  • Brian

5 Likes

I got to it a couple of days late but I did it :sweat_smile:. My approach was relatively simple. Mainly because I’ve never done this before. It was definitely a good brain teaser for me.

2 Likes

Funny that this was a workout - I had this as a question on the EDNA Site a few months ago.

DAX Workout No2 MB.pbix (1.2 MB)

2 Likes