Visualization drill down not showing. I can only drill through the non-compliant data and not the compliant ones.
I have created a formula to check how much data is compliant and non-compliant. For example, if the customer has all the fields populated then he is compliant, so their details are missing from the Query1 table. If the member has a missing information, then he is non-compliant and will be available in the query table.
<Compliant Formula = DISTINCTCOUNT(‘DW v_Member’[MemberNum])/CALCULATE(DISTINCTCOUNT(Query1[MemberNum]),ALL(Query1))
Non-Compliant= 1- ( DISTINCTCOUNT(‘DW v_Member’[MemberNum])/CALCULATE(DISTINCTCOUNT(Query1[MemberNum]),ALL(Query1)))>
I have also created a calculated column in the member table to check if I can showcase both compliance and Non-compliance data but that is also not working
<Compliance Check =
IF(
COUNTROWS(
FILTER(
Query1,
Query1[MemberNum] = ‘DW v_Member’[MemberNum]
)
) > 0,
“Non Compliant”,
“Compliant”
)>
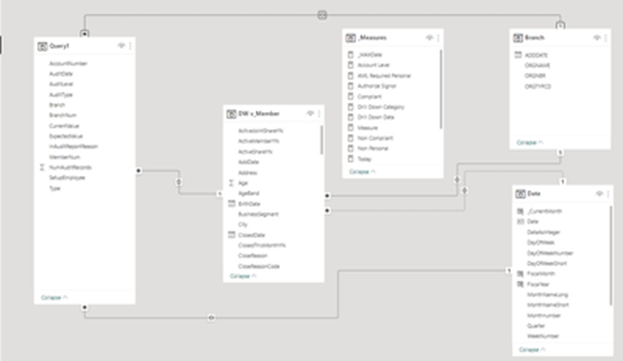
Table information:
Dw_Member: is a fact table with all customer information
Branch is a fact table with all of company branches
Date table
Query 1 comprises of only those customers whose profile has a missing information for example date of birth or address etc. A customer can appear more than once if they have multiple information missing
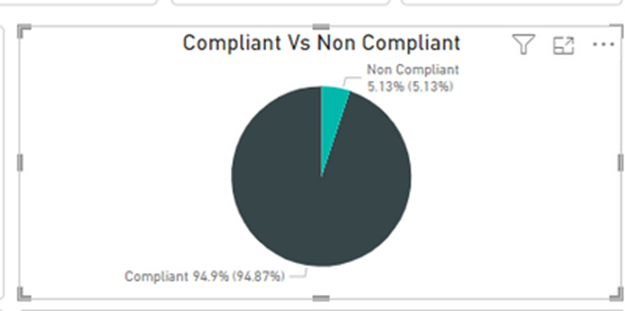
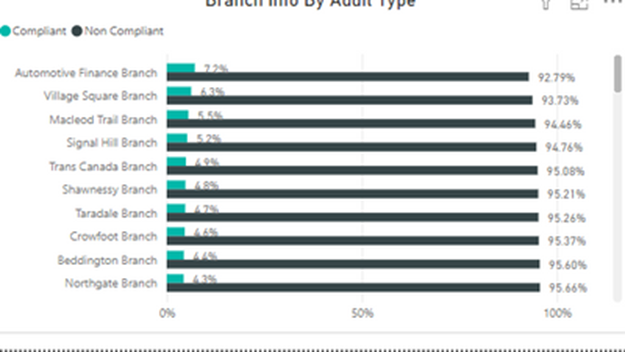
Donut chart appears correctly with compliant and non-compliant measures, but all other measures are not getting drilled through see second chart
Not showing correct result
Plus If I try to use a slicer it is only giving me Non compliant calculation as 100%
In your Measures you are using ALL and removing all filters on Query1, so you are always comparing the number of members in the current filter context in DW members to all members in Query1.
Do you need to remove filters in this case as you have all members in DW Members, and all non compliant in Query1, comparing the distinct count of each in any filter context should give you the ratio at that granularity, if im reading it correctly.
I need filters as I am trying to showcase which branch is more compliant than other.
CALCULATE(DISTINCTCOUNT(Query1[MemberNum]),ALL(Query1)
Will remove all filters from Query1 when doing the distinct count, so you are dividing the amount of people in DW members table DISTINCTCOUNT(‘DW v_Member’[MemberNum]) in the current filter context with Query1 (Which is non compliant people) with no filters applied.
If you had 100 members and 50 non compliant and had a visual with no filters it would be 100/50, if 25 of the non compliant were in dept A, and 50 of the total members were in dept A it would be 50/50 in the filter context of dept A because the filters are removed for the distinct count of Query1.
Thats how I am reading it, so your filters are not having any affect on the second part of the measure, to try it break your measure into variables for each part, so thats 4 variables, and return their values, you will be able to see how many members are included in each cell.
Hello @rahulbuzz,
Did the responses above help solve your query?
If not, can you let us know where you’re stuck and what additional assistance you need?
If it did, please mark the answer as the SOLUTION by clicking the three dots beside Reply and then tick the check box beside SOLUTION
Thank you
Hi @rahulbuzz
We’ve noticed that no response was received from you on the post above.
Just following up if you still require assistance to solve your inquiry.
In case there won’t be any activity on it in the next few days, we’ll be tagging this post as Solved.
Hi @rahulbuzz
We have noticed that your inquiry has remained unresolved for an extended period of time, indicating that it may have been outside the capabilities of our experts and users.
If you believe that you have provided all the necessary context for your concerns and have familiarized yourself with effective forum usage by referring to this guide, we recommend exploring the additional resources included with your subscription. These resources can provide valuable assistance with your Power BI education, and we encourage you to utilize them.
While our users and experts strive to assist with inquiries to the best of their abilities, it is important to acknowledge that not all concerns can be addressed, particularly when there are valuable learning opportunities involved. Thank you for your understanding.
We sincerely hope that you find the solution you are seeking and achieve your desired outcome.