Wow!!! – I can see why this one gave you problems. It took me three nights and the most complex measure I’ve ever written to finally slay this beast, but I think I’ve got it.
Here’s what I did:
-
built a more robust data model, including a customer dimension table and index values for the various plans, both in order to sort them properly and also to compare them correctly numerically in the SWITCH statement that assigns the icon.
-
built the main measure - while I usually adhere to the measure branching approach, but for this complex a measure I did not. Instead, I built this up sequentially using variables, materializing it in a DAX expression physical table, so that I could easily change the variable referenced in the final RETURN statement to quickly view the outcomes of each variable. It was also easier to troubleshoot context issues having everything laid out in one measure.
Note: part of the reason this measure is so long and complex is that there are some difficult data lineage problems to overcome in the use of virtual tables here. This really highlighted the point in my recent practice video about the importance of familiarity versus mastery. I ended up having to use a number of functions that I rarely ever touch (e.g., GROUPBY instead of ALLEXCEPT, CONTAINS instead of TREATAS, DISTINCT and SELECTCOLUMNS, instead of VALUES and SUMMARIZE, etc.). I certainly don’t have mastery of some of these rarely used functions, but I did know that they existed, generally what they did and what they could be used in place of. When I would hit a dead end with my usual functions, I would look these up in the Definitive Guide to DAX to learn the specifics.
- wrote a relatively simple SWITCH( TRUE() ) to compare the previous and selected month’s plan index values to assign a relevant icon. I used @marcster_uk’s cool trick of the Windows key plus the period key to bring up the emoji board, and then copied the relevant symbols directly into my measure.
Here’s the behemoth 150-line measure that does almost all the heavy lifting:
Count of Same Cust Who Bought LM =

VAR CurrMoInCal =  SELECTEDVALUE( Dates[MonthInCalendar] )
VAR LastMoInCal =
    CALCULATE(
        MAX( Dates[MonthInCalendar] ),
        DATEADD(
            Dates[Date],
            -1,
            MONTH
        )
    )

VAR SelPlan = SELECTEDVALUE( 'Comparison Bundle'[Plan] )
VAR SelPlanDimBundles = SELECTEDVALUE( DimBundles[Plan] )
VAR SelPlanDisconDimBundles = SELECTEDVALUE( 'Disconnected Unfiltered DimBundles'[Plan] )

VAR CustListThisMo =
CALCULATETABLE(
    ADDCOLUMNS(
        SUMMARIZE(
            Data,
            Data[Customer Number]
        ),
        "MaxPlan", [Max Plan Purchased Curr],
        "MaxIndx", [Max Index Purchased in Selected Mo]
    ),
    Data[Month Yr] = CurrMoInCal
)

VAR CustListLastMo =
CALCULATETABLE(
   Data,
    FILTER(
        FILTER(
            ALL( Data ),
            Data[Month Yr] = LastMoInCal
        ),
        Data[Plan] = SelPlan
    )
)

VAR DistLastMo =
SELECTCOLUMNS(
    CustListLastMo,
    "@DistinctCustLM", [Customer Number]
)

VAR DistThistMo =
SELECTCOLUMNS(
    CustListThisMo,
    "@DistinctCustTM", [Customer Number]
)

VAR IntersectTable =
INTERSECT(
    DistLastMo,
    DistThistMo
)

VAR IntTablePlusMaxPlan =
DISTINCT(
    ADDCOLUMNS(
        IntersectTable,
        "@MaxPlan", [Max Plan Purchased Curr],
        "@MaxPlanIdx", LOOKUPVALUE( DimBundles[Plan Index], DimBundles[Plan], [Max Plan Purchased Curr] )
    )
)

VAR TabulateTable =
GROUPBY(
    IntTablePlusMaxPlan,
    [@MaxPlan],
    [@MaxPlanIdx],
    "@CustCount",
        COUNTAX(
            CURRENTGROUP(),
            [@MaxPlan]

        )
)

VAR ResultCrossJ =
ADDCOLUMNS(
    CROSSJOIN(
        TabulateTable,
        'Disconnected Unfiltered DimBundles'
    ),
    "@NetIdx", [Plan Index] - [@MaxPlanIdx]
)

VAR ResultCrossJFilt =
CALCULATETABLE(
    ResultCrossJ,
    FILTER(
        ResultCrossJ,
        [@NetIdx] = 0
    )
)

VAR PrelimResult =
CALCULATE(
    MAXX(
        FILTER(
            ResultCrossJFilt,
            CONTAINS(
                'Disconnected Unfiltered DimBundles',
                'Disconnected Unfiltered DimBundles'[Plan],
                [@MaxPlan]
            )
        ),
        [@CustCount]
    ),
    FILTER(
        ResultCrossJFilt,
        [@MaxPlan] = SELECTEDVALUE( 'Disconnected Unfiltered DimBundles'[Plan] )
    )
)

VAR vTable =
ADDCOLUMNS(
    SUMMARIZE(
        'Disconnected Unfiltered DimBundles',
        'Disconnected Unfiltered DimBundles'[Plan]
    ),
    "@PrelimPlan", PrelimResult
)

VAR Result =
CALCULATE(
    IF( HASONEVALUE( 'Disconnected Unfiltered DimBundles'[Plan] ),
        PrelimResult,
        SUMX(
            vTable,
            [@PrelimPlan]
        )
    ),
    TREATAS(
        SELECTCOLUMNS(
            vTable,
            "@PrelimPlan", [@PrelimPlan]
        ),
        'Disconnected Unfiltered DimBundles'[Plan]
    )
)

RETURN
Result
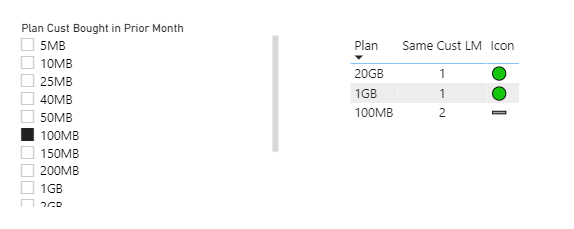
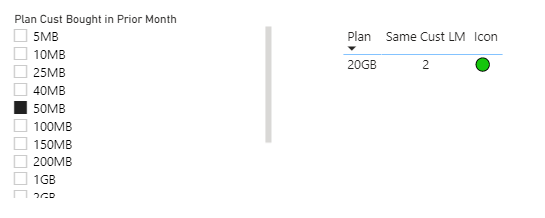
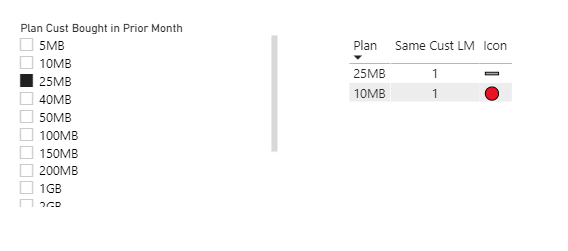
And here are three screenshots of different testing values used to confirm that the measure was working correctly:


I hope this is helpful to you. Really enjoyed working on this one with you, and learned a ton from the experience.
Thanks! Full solution file posted below.
- Brian
eDNA Forum - Same Customers as Last Month Solution2b.pbix (92.5 KB)
@Pete673 - Thanks for your patience while I wrestled with this one. Yours is next up in the batter’s box. Starting on it now…