DAX - Two Months Same customer count

Hi ALL,

I am stuck with a scenario wherein I need to calculate the count of rows of same customers (current month vs previous month). I have used the calculation as below -
Same Customer L2M Count =
VAR CustomersTM = VALUES(Sheet1[Customer Number])
Var CustomerLM = CALCULATETABLE(VALUES(Sheet1[Customer Number]),ALL( DimBundles ),
TREATAS( VALUES( ‘Comparison Bundle’[Plan]), Sheet1[Plan] ),DATEADD(‘Invoked Function’[Date],-1,MONTH))
Return
IF(SELECTEDVALUE(DimBundles[Plan]) = SELECTEDVALUE(‘Comparison Bundle’[Plan]),BLANK(),COUNTROWS(INTERSECT(CustomerLM,CustomersTM)))

This works perfectly for the customer who have bought a different product in the current month, but if a customer has brought same product _ different product in the current month it counts it twice. logically it is correct , but in my case i want it to count only for MAX index product brought by the customer i.e. in the attached image you would see the max index product is 20GB and it should count only that and not the 100 MB row.

Kindly request you all to help me with the same.

@BrianJ - It would be great if you can have a look at this scenario.

Attached is the PbixSample report.pbix (67.8 KB)

@Vishy,

Be glad to take a look at this one after work tonight. Previous values, TREATAS, INTERSECT - this is like DAX catnip - I’m hooked already… :smiley:

Hopefully, have something back to you later tonight.

  • Brian

Hi @Vishy, please be sure to check out our DAX Clean Up tool it’s a great way to ensure to make your DAX code easy to read. Thanks!

https://analysthub.enterprisedna.co/dax-clean-up

@Vishy,

Very interesting problem. However, either I’ve misunderstood the basic question or you’ve got a lot of unnecessary complexity in your measure. As I understand the problem, it’s just “how many unique customers this month also made at least one purchase last month?”. Is that the proper framing of the basic question? If so, the problem simplifies greatly since it doesn’t matter WHAT each customer bought in a given month, just that they did or didn’t make a purchase at all.

So here’s the approach I took:

  1. Captured selected MonthInCalendar
  2. Calculated previous MonthInCalendar using DATEADD
  3. Calculated table of distinct customers in selected MonthInCalendar
  4. Calculated table of distinct customers in previous MonthInCalendar
  5. Did a COUNTROWS of the intersections of the virtual tables created in 3. and 4. above

Thus, no need for TREATAS, the disconnected slicer, or any filtering at all on specific product(s) purchased.

As a bonus, I created a second measure that is almost identical to the first, but returns the CONCATENATEX-generated list of customer index values, rather than the # of rows in step 5. Here’s the outcome and the relevant measures:

Count of Same Cust Who Bought LM = 
VAR CurrMoInCal =  SELECTEDVALUE( Dates[MonthInCalendar] )
VAR LastMoInCal = 
    CALCULATE( 
        MAX( Dates[MonthInCalendar] ),
        DATEADD(
            Dates[Date],
            -1,
            MONTH
        )
    )

VAR CustListThisMo = 
CALCULATETABLE(
    DISTINCT( Data[Customer Number] ),
    Dates[MonthInCalendar] = CurrMoInCal
)

VAR CustListLastMo = 
CALCULATETABLE(
    DISTINCT( Data[Customer Number] ),
    Dates[MonthInCalendar] = LastMoInCal
)

VAR Result =
COUNTROWS(
    INTERSECT(
        CustListLastMo,
        CustListThisMo
    )
)

RETURN Result

For the second measure, everything is identical, except the final Result variable

VAR Result =
CONCATENATEX(
    INTERSECT(
        CustListLastMo,
        CustListThisMo
    ),
    Data[Customer Number],
    ", ",
    Data[Customer Number],
    ASC
)

I hope I hit the proper mark on this one. Full solution file attached.

2 Likes

HI BrainJ,

So here i would like to explain the business scenario,

  1. The stakeholder wants to see Same customer purchasing a plan last month has bought the upgraded plan or downgraded plan and understand customer behavior accordingly.

  2. So the requirement is also for any selected month in calendar, stakeholder should be able to select a plan( reason for creating the disconnected table - slicer) and accordingly in a table visual he should be able to see to which new plan he has bought for the current month. That would basically help the business to understand how many customer upgraded or downgraded their plans.

If you select 100 mb in the report i shared , it will display only one value which is 1GB for User B, which means a user who bought 100 mb in March has upgraded himself to 1GB this month and based on that i create a condition column with Up or down arrow mark against those packages(attaching the screenshot of original data just for reference to show how the user would see). This works correctly for a customer who has only one plan in the current.

Now consider a scenario wherein a customer who bought 50 mb in the last month has brought 25mb and also 1gb. Which means he has actually being moved to a upgraded plan. But with my logic it is counting that customer as 1 for 25mb and for 1 gb as well which means that in the condition column this customer would be counted in the downgraded package and also in upgraded package.
But the requirement here is to consider his count only for the 1gb plan and not for 25mb because customer actually belongs to upgraded plan group of people.

Hope this clarifies the requirement. Attaching the screen shot of what i am trying to do with actual data set.

here in the attachment if you see same customer who has brought 120 MB in March there are around 3324 customer who actually moved to a lower plan this month and 475 customer who moved to upgraded plan.
this looks correct but as said above if you check for customers who bought multiple plans downgraded and also upgraded screen shot attached (capture 2)

so if you check screen shot 2 you will see that this customer for the month of april brought 25mb 80mb and also 300 mb , buthis count should be considered only for 300mb group because he actually upgraded himself.

So the way i have created rate measure is - fetching the index of the slicer selection , checking whether that index selected is greater or low then the selected index of the plans in the table visual and formatting it accordingly.

Rate measure -
Rate Measure =

Var _ComaprisonIndex = SELECTEDVALUE(‘Comparison Bundles’[Index])

Var _DimBundlesIndex = SELECTEDVALUE(DimBundles[Index])

Return

SWITCH(True,

_DimBundlesIndex < _ComaprisonIndex,0,

_ComaprisonIndex = _DimBundlesIndex,BLANK(),1)

@BrianJ - I am open to other approaches here, hope the use case is understood. Thanks once again.

@Vishy,

OK - got it now. Thanks very much for the additional explanation. I’m off to bed now, but will rework this tomorrow and have a revised solution back to you.

  • Brian

P.S Do you have a bigger sample dataset I can test on?

@BrianJ - I was able to created around 40 records more in the dataset. Hope this would help Sample report_latest.pbix (65.2 KB)

Have attached the file as well.

@Vishy,

Sorry – one more request. Can you please also attach Sample Report.xlsx? I need that to do some Power Query work related to the data model, which will tie into the overall solution.

Thanks.

  • Brian

@BrianJ - here you go –Sample Report.xlsx (10.5 KB)

:+1: - thanks for the quick response. Will have a revised solution back to you later tonight…

  • Brian

@Vishy,

UPDATE: almost done – just need to finish debugging the last portion of a long measure . Took me longer than expected tonight – started down a bad path and had to backtrack, costing me some time. Need to call it a night, but should have it done for you tomorrow. Sorry for the delay.

  • Brian

I appreciate all your efforts :slight_smile: and eager to look at the solution as well.

@Vishy,

Wow!!! – I can see why this one gave you problems. It took me three nights and the most complex measure I’ve ever written to finally slay this beast, but I think I’ve got it.

Here’s what I did:

  1. built a more robust data model, including a customer dimension table and index values for the various plans, both in order to sort them properly and also to compare them correctly numerically in the SWITCH statement that assigns the icon.

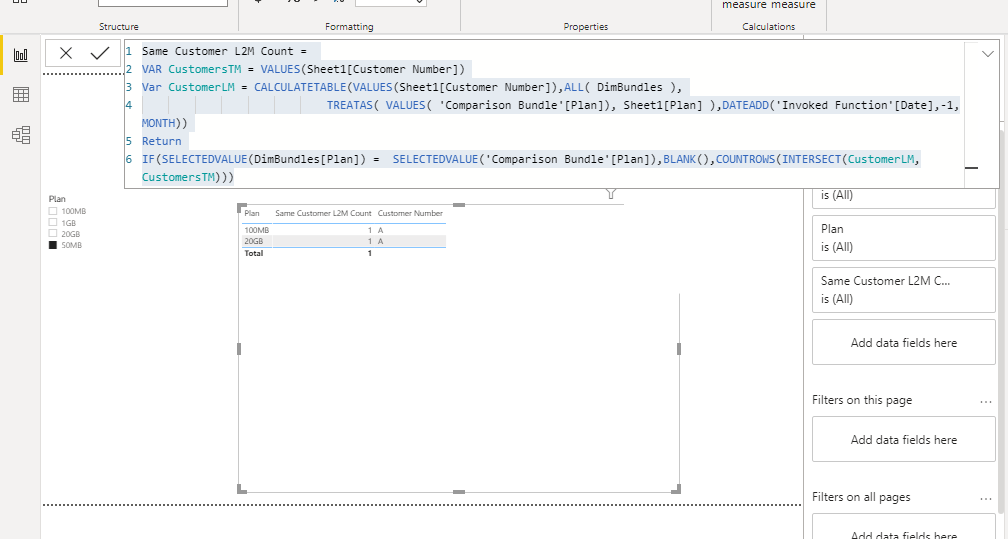
  2. built the main measure - while I usually adhere to the measure branching approach, but for this complex a measure I did not. Instead, I built this up sequentially using variables, materializing it in a DAX expression physical table, so that I could easily change the variable referenced in the final RETURN statement to quickly view the outcomes of each variable. It was also easier to troubleshoot context issues having everything laid out in one measure.

Note: part of the reason this measure is so long and complex is that there are some difficult data lineage problems to overcome in the use of virtual tables here. This really highlighted the point in my recent practice video about the importance of familiarity versus mastery. I ended up having to use a number of functions that I rarely ever touch (e.g., GROUPBY instead of ALLEXCEPT, CONTAINS instead of TREATAS, DISTINCT and SELECTCOLUMNS, instead of VALUES and SUMMARIZE, etc.). I certainly don’t have mastery of some of these rarely used functions, but I did know that they existed, generally what they did and what they could be used in place of. When I would hit a dead end with my usual functions, I would look these up in the Definitive Guide to DAX to learn the specifics.

  1. wrote a relatively simple SWITCH( TRUE() ) to compare the previous and selected month’s plan index values to assign a relevant icon. I used @marcster_uk’s cool trick of the Windows key plus the period key to bring up the emoji board, and then copied the relevant symbols directly into my measure.

Here’s the behemoth 150-line measure that does almost all the heavy lifting:

Count of Same Cust Who Bought LM = 

VAR CurrMoInCal =  SELECTEDVALUE( Dates[MonthInCalendar] )
VAR LastMoInCal = 
    CALCULATE( 
        MAX( Dates[MonthInCalendar] ),
        DATEADD(
            Dates[Date],
            -1,
            MONTH
        )
    )

VAR SelPlan = SELECTEDVALUE( 'Comparison Bundle'[Plan] )
VAR SelPlanDimBundles = SELECTEDVALUE( DimBundles[Plan] )
VAR SelPlanDisconDimBundles = SELECTEDVALUE( 'Disconnected Unfiltered DimBundles'[Plan] )

VAR CustListThisMo = 
CALCULATETABLE(
    ADDCOLUMNS(
        SUMMARIZE(
            Data,
            Data[Customer Number]
        ),
        "MaxPlan", [Max Plan Purchased Curr],
        "MaxIndx", [Max Index Purchased in Selected Mo]
    ),
    Data[Month Yr] = CurrMoInCal
)

VAR CustListLastMo = 
CALCULATETABLE(
   Data,
    FILTER(
        FILTER(
            ALL( Data ),
            Data[Month Yr] = LastMoInCal
        ),
        Data[Plan] = SelPlan
    )
)

VAR DistLastMo =
SELECTCOLUMNS(
    CustListLastMo,
    "@DistinctCustLM", [Customer Number]
)

VAR DistThistMo =
SELECTCOLUMNS(
    CustListThisMo,
    "@DistinctCustTM", [Customer Number]
)

VAR IntersectTable =
INTERSECT(
    DistLastMo,
    DistThistMo
)

VAR IntTablePlusMaxPlan =
DISTINCT(
    ADDCOLUMNS(
        IntersectTable,
        "@MaxPlan", [Max Plan Purchased Curr],
        "@MaxPlanIdx", LOOKUPVALUE( DimBundles[Plan Index], DimBundles[Plan], [Max Plan Purchased Curr] )
    )
)

VAR TabulateTable =
GROUPBY(
    IntTablePlusMaxPlan,
    [@MaxPlan],
    [@MaxPlanIdx],
    "@CustCount",
        COUNTAX(
            CURRENTGROUP(),
            [@MaxPlan]
         
        )
)

VAR ResultCrossJ =
ADDCOLUMNS(
    CROSSJOIN(
        TabulateTable,
        'Disconnected Unfiltered DimBundles'
    ),
    "@NetIdx", [Plan Index] - [@MaxPlanIdx]
)

VAR ResultCrossJFilt =
CALCULATETABLE(
    ResultCrossJ,
    FILTER(
        ResultCrossJ,
        [@NetIdx] = 0
    )
)

VAR PrelimResult =
CALCULATE(
    MAXX(
        FILTER(
            ResultCrossJFilt,
            CONTAINS(
                'Disconnected Unfiltered DimBundles',
                'Disconnected Unfiltered DimBundles'[Plan],
                [@MaxPlan]
            )
        ),
        [@CustCount]
    ),
    FILTER(
        ResultCrossJFilt,
        [@MaxPlan] = SELECTEDVALUE( 'Disconnected Unfiltered DimBundles'[Plan] )
    )
)

VAR vTable =
ADDCOLUMNS(
    SUMMARIZE(
        'Disconnected Unfiltered DimBundles',
        'Disconnected Unfiltered DimBundles'[Plan]
    ),
    "@PrelimPlan", PrelimResult
)

VAR Result =
CALCULATE(
    IF( HASONEVALUE( 'Disconnected Unfiltered DimBundles'[Plan] ),
        PrelimResult,
        SUMX(
            vTable,
            [@PrelimPlan]
        )
    ),
    TREATAS(
        SELECTCOLUMNS(
            vTable,
            "@PrelimPlan", [@PrelimPlan]
        ),
        'Disconnected Unfiltered DimBundles'[Plan]
    )
)
                   
RETURN
Result

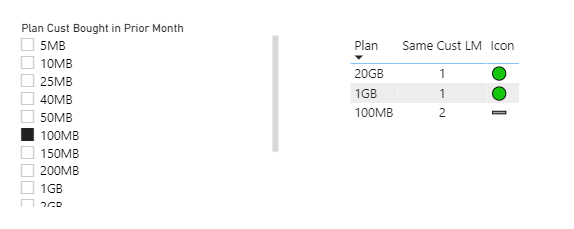
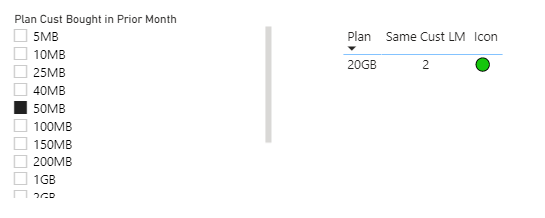
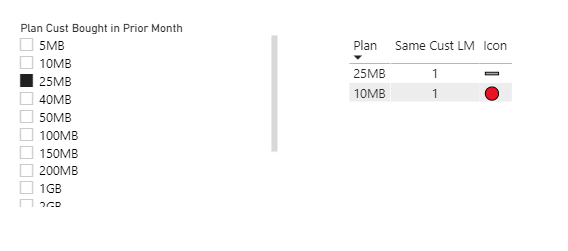
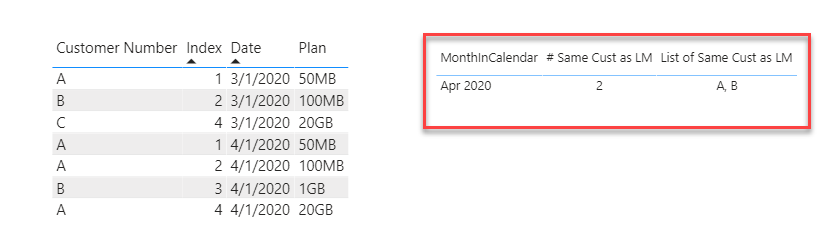
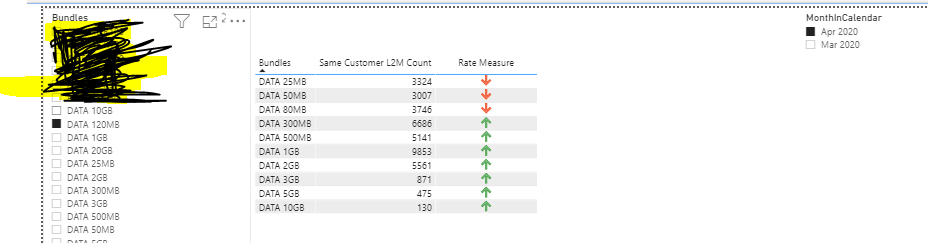
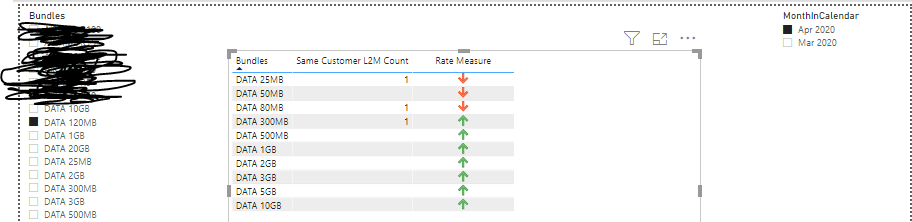
And here are three screenshots of different testing values used to confirm that the measure was working correctly:

image

image

image

I hope this is helpful to you. Really enjoyed working on this one with you, and learned a ton from the experience.

Thanks! Full solution file posted below.

@Pete673 - Thanks for your patience while I wrestled with this one. Yours is next up in the batter’s box. Starting on it now…

3 Likes

Amazing stuff @BrianJ
:clap: :clap: :clap:

@BrianJ - Thanks so so much!!! it is really awesome that you got this through. I will unpack each of your calculations and if u get stuck any where would surely bug you here:) Thanks once again for your time really appreciated.

@Vishy,

It’s a lot to unpack. :grinning:

I think the easiest way to understand what’s going on is to work through it variable by variable. I left the physical table (called Table2) that I used to build the measure in the data model for this very purpose. To step through it, just change the RETURN statement to reflect the variable you want to review (make sure you are in data view mode - that’s the only place the little results box will appear at the bottom). Most of the variables are table variables, which you can view directly.

For the scalar variables, you’ll need to convert these to a table first. You can do so using ROW( “name”, variable) in the RETURN statement.

  • Brian

Yes i was able to unpack , yeah rightly said by you i did refer the Table for understanding it quickly , thanks so much it has helped me as well to learn more things. May be tomorrow i will put this into my actual product model and update you. I just updated the tabulated step with Datatable constructor and verified the values in following steps to check the final outcome , so it helped to get through it quickly.

@Vishy,

Great! How big is your actual dataset? I’m curious as to how fast/slow it runs. I know that GROUPBY in particular can slow things down.

  • Brian

So i would be getting the prod data of entire year may be by tomorrow or day after tomorrow, currently i have data only of April-March which sums to be around 3,000,00 rows

@BrianJ - I am here again to trouble you, so the DAX is working perfectly fine and fast now, just want to know is there any possibility to get the actual customer number who fall under that count example if 20GB = 2 count , how can i get to know the customer number of those two customers. I did tried drill through it works perfectly for the data set provided in our sample but now my actual data set for only April to August 2021 is about 10 M rows and the drill through doesn’t load at all. Do you have any idea for this scenario

@Vishy,

I’m thrilled to hear that the code is running well and is sufficiently fast even on a large dataset - I was a bit worried about that latter issue when I provided the original solution.

Re: your question about retrieving the customer IDs - I am confident we can do that. While working on your initial solution I learned a cool trick that I think will pay off here - you can’t call LOOKUPVALUE directly on a virtual table, but you can call it indirectly if you embed it within an ADDCOLUMNS/SUMMARIZE structure.

I’ve got one in the queue ahead of yours, but am hoping I can finish both tonight.

Can you please do me one favor in the interim - since this is really a new (but related) question on a solved thread, can you please open a new topic and re-post your message above? This helps us better track threads that still need a response.

Thanks - will get back to you soon.

  • Brian