I am a newbie and learning my DAX steps here. I am running into an issue with my Totals. I have looked at the sample video and could not apply the same to my model. Hope someone can help me out in this forum.
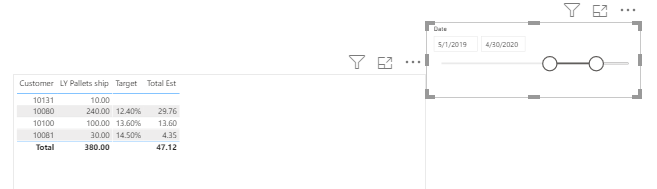
I have the transactions in the shipment table. The target shipment for customers are in another table. My visual should show the last Year shipment in Pallet, Target % and the Estimated Shipment( Last year shipment + TArget%) . My individual rows are calculated correctly , but the Grand total is showing wrong.
The attached PBIX file is not showing the issue. Unfortunately, I cannot put my Pbix in public due to security reasons. I had seen the summarize option used in the forum, but i am having trouble in applying that in to this model.
I was not sure if i am using the right approach to show the estimated total. Please advice.
This is one of those problems where if you ask five people, you’ll probably get five different and equally valid approaches. Here’s the way I usually handle these, using a combination of a small virtual table and the HASONEVALUE() function:
Total Est =

 VAR vTable =
 ADDCOLUMNS(
     SUMMARIZE(
         'Customer ship Target',
         'Customer ship Target'[Customer]
        ),
    "vToTEst", [Est Row Value]
 )

VAR Result =
 IF( HASONEVALUE( 'Customer ship Target'[Customer] ),
    [Est Row Value],
    SUMX(
        vTable,
        [vToTEst]
    )
 )

 RETURN
 Result
The first variable creates a virtual table of two columns - your unique customer values, and your simple estimated value product measure.
The second variable tests whether you are in a data row of the table (HASONEVALUE on customer is true) or the total row (HASONEVALUE on customer is false). In the first case, it returns your measure, but for the total row it returns the sum of those measures over all customers in the virtual table created above.
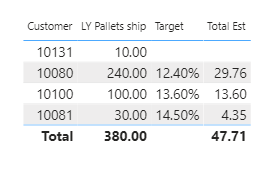
And here’s what it looks like put together back in the visual – now with the correct total.
I hope this is helpful. Full solution file posted below.
Hi @train, a response on this post has been tagged as “Solution”. If you have a follow question or concern related to this topic, please remove the Solution tag first by clicking the three dots beside Reply and then untick the check box. Thanks!
Thanks @BrianJ. This is good explanation of how to utilize this function.
Had to change the main shipment table and include the product group. Was just wondering how the HASONE VALUE will fit in here as i will need to look at the combination of Customer and Product Group.
It all depends what you’re including in your visual. The basic idea is that you just need DAX, as it iterates down the virtual table that mirrors your visual, to be able to distinguish between a data row and the total row using some Boolean function. In order of frequency I use HASONEVALUE, ISINSCOPE (great for matrix subtotals and totals) and HASONEFILTER, sometimes in combination with each other. (The next video I have coming out on the Enterprise DNA YouTube channel this month has an example using the last two in combination with SWITCH(TRUE()).
If you can please post an updated version of your PBIX file, I’d be glad to work through with you how to restructure the measure given the updated fact table.