DAX to visualize longitude and latitude from two tables

Hello,
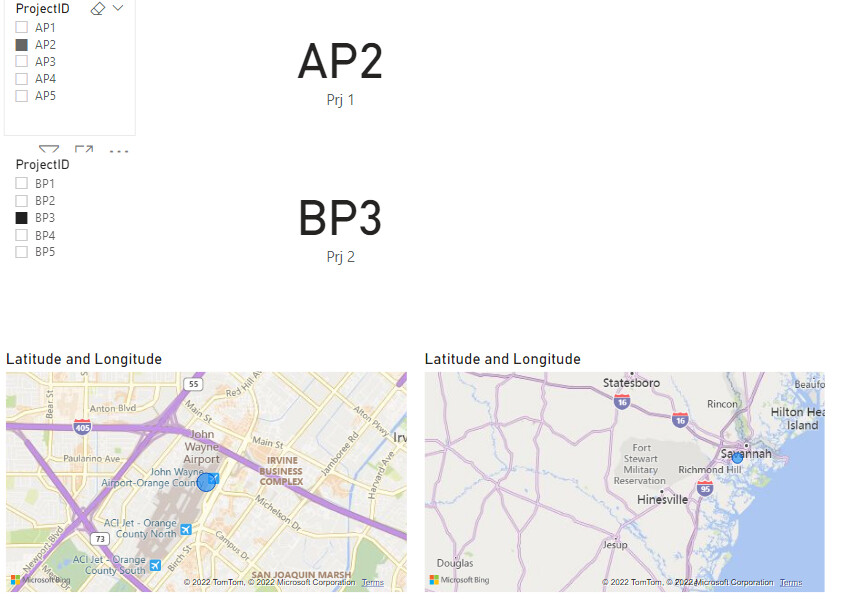
I have a requirement where I have to show longitude and latitude of the location of the projects that are being compared. These projects are coming from two different tables. In the map visual we have an option only to choose one longitude and latitude from single table. Is there a way to show both the values from different tables in a single map visual? Attaching the pbix file for reference.

Is there a way to show the latitude and longitude of both AP4 and BP1 in the map visual? Is it possible at all?
VisualizingLatitudeLongitude.pbix (30.7 KB)

Thank you!

Hi @Vsb79,
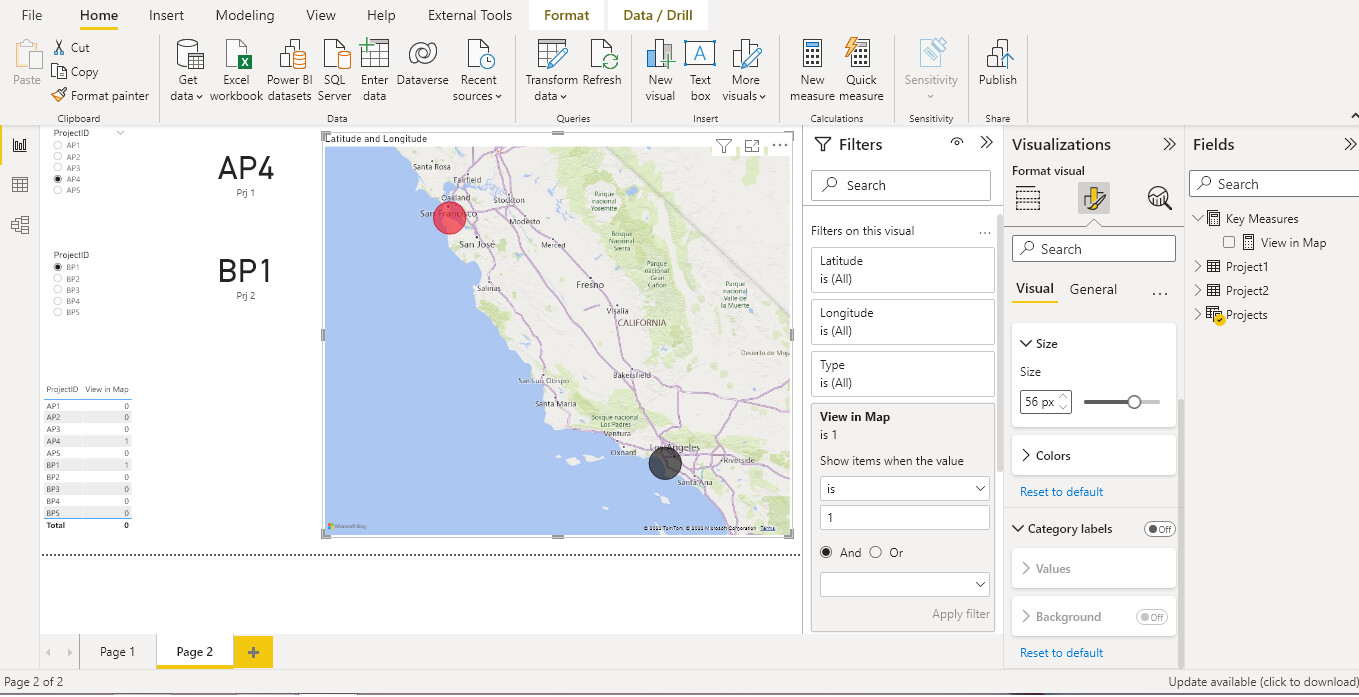
I share a possible solution in which we create a calculated table with the union of the two project tables and add a Type column to use it as a Legend on the map and be able to give a color to the projects in the Project1 table and a different color to the projects in the second table.
This is the calculated table:

projects =
VAR _Project1 = ADDCOLUMNS( Project1, “Type”, LEFT([ProjectID], 1 ) )
VAR _Project2 = ADDCOLUMNS( Project2, “Type”, LEFT([ProjectID], 1 ) )
VAR _Result = UNION( _Project1, _Project2 )
RETURN _Result

Then we create a measure to know if the project has been selected in each of the slicers.

View in Map =
VAR _IDProject1 =
SELECTEDVALUE( Project1 [ProjectID] )
VAR _IDProject2 = SELECTEDVALUE( Project2 [ProjectID] )
VAR _Result = IF(
SELECTEDVALUE( Projects[ProjectID] ) = _IDProject1 ||
SELECTEDVALUE( Projects[ProjectID] ) = _IDProject2,
1,
0
)

RETURN
_Result

We put this measure as a map filter so that it shows the projects if View in Map = 1.

I hope it can be useful to you.
Regards.

VisualizingLatitudeLongitude_JAFP.pbix (38.7 KB)

1 Like

That was really helpful, Thank you @jafernandezpuga, Jose. Appreciate it.

1 Like