Hi,
Please help with the correct DAX for the below calculation? I really struggle to find a solution.
I want to flag non-paying customers becoming a risk - by counting the times an unpaid arrears amount for each customer “moves” over three consecutive months.
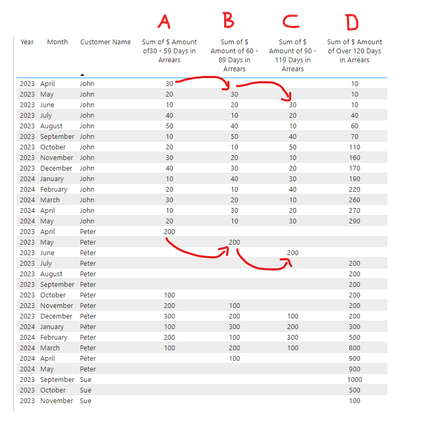
Monthly I receive a dataset with customers with their amounts in arrears. The arrear amounts are grouped in one of four monthly progressive groups: 30-59 days, 60-89 days, 90-119 days, and over 120 days.
Let say John owes $30 as part of the “30-59 days” group in April 2023 but then doesn’t pay it, and that $30 moves to the “60-89 days” arrears in May 2023, and then to the “90-119 days” group in June 2023, it will probably end up in the “over 120 days” in July 2023.
If this same patterns continues for all his arrear amounts as times passes, moving from “30-59 days” to “90-119 days” over three consecutive months, John is to be flagged as a risk to be monitored more closely.
So my idea is to count the number of times, for each customer, a specific arrears amount moves from the:
- “30-59 days” category to the “90-119 days” category (with each such movement counting as 1).
The aim is to create a table ranking the customers with counts per year sorting from highest count to lowest. Ideal output will look something like this:

Please help me with the DAX to accomplish the above?
To calculate for Peter, the logic is as follows:

The PBIX file is here with the example date as copied below. (Has a date table.) The underlying data in Excel is here.

Thank you very much!
William