DAX to compare fields from two different sources

I have two source systems where one system keeps track of the daily data which has entry for each day for the vehicle is driven. It has the number of hours driven/day and the location the car is driven. And there are multiple car models. There can be days when there is no entry for that car. In such a case, it should not filter the dates column, but should show blank where there is no entry. For example, for Toyota, on Jan2nd,3rd,10th,16,17,27, it should show blank instead of not showing that record in the table. Same with Honda. I understand this can be achieved using powerquery merge, but my tables are already in data model. Is there a DAX to do that outer join?

And, for the RangeofHours, the information this table has is for a range of dates for which the car should be at a particular location. And, I have a question on how to create the relationship between the date table and this RangeofHours table. When you have a table that has a range of hours from start date to end date, how to connect with the date table?

The problem I am trying to solve is I have to compare if the car is driving the target number of hours that it should (defined in the RangeofHours table).

This is done by calculating the number of hours the car drove on a daily basis from DailyHours table, and its location for the number of days that are selected in the date table and also pull the TargetDriveTime and RangeofCarLocation from RangeofHourse table side by side.

Also, in another tab show for the dailydrivetime,dailylocation, targetdrivetime,RangeofCarLocation without the date column, but result showing with the date slicer for a duration selected.

Say the user selected a date range from 1/10/2021 to 1/20/2021, The total number of working days will be 8 days. I have to calculate the total drive time for each specific car (individually to be able to filter by car with a filter) within the date range in the date slicer selected for the different locations that have a start and end date. But, should display daily TargetDrivetime for weekdays and should be blank for weekends if looking on a daily basis.
For location(RangeofCarLocation) 121, Even though its start date is in Oct 2020, the date slicer is from 1/10/2021, and end date is within the date range selected and the number of working days will be 8.

So, for the dates 16th,17th, the DailyCarlocation should be blank,and DailyDrivetime should show blank. And the same thing with RangeofCarLocation from RangeofHours table.

I tried multiple ways to create the relationships and creating the dax for calculating the hours and hoping I get help from this amazing Enterprise DNA forum. Attaching the pbix file as well. Thank you in advance.
EDNAFile.pbix (93.7 KB)
Hi,

what would be your expected result if you provide that as well then i will try to solve the above problem.

Thanks,
Anurag

Thank you for the quick response,Anurag. I’d appreciate it. Please find attached the files

EDNAResultsetExpected.xlsx (33.6 KB)
EDNAFileTest.pbix (82.6 KB)
DateRangeHours.xlsx (8.9 KB)
DailyHours.xlsx (9.5 KB)

Basically, its a comparison between two different sources, for specific car model, the number of hours driven each day for the date range selected. It should capture even if its a weekend or even if there is no data for a specific day from DailyHours table(showing blank). And calculating the target hours only during weekdays. The purpose is to compare the hours (for weekdays).

There is a little error in the pbix file provided. Attached are the updated files with the resultset that is expected.

EDNAResultsetExpected.xlsx (33.6 KB)
EDNAFileTest.pbix (82.6 KB)
DateRangeHours.xlsx (8.9 KB)
DailyHours.xlsx (9.5 KB)

Basically, its a comparison between two different sources, for specific car model, the number of hours driven each day for the date range selected. It should capture even if its a weekend or even if there is no data for a specific day from DailyHours table(showing blank). And calculating the target hours only during weekdays. The purpose is to compare the hours (for weekdays).

Thank you very much!!

Bumping this post for more visibility.

Hi @Vsb79 , (revised, simpler data model, without 2 not needed lookup tables)

Please receive hereby a workout for comparing the two data sources, Driven Hours and Target Hours.

I have chosen to extend the Target source data, and set up a data model with an extended Lookup table, which has resulted in three basic DAX-formulas to create reports.
PBIX attached:
Car occupation v8a.pbix (191.2 KB)

Steps taken:

  1. Replace the target given per date range at each Target drive hours per Model per Location for a target per day (extending the table) in Power Query using the code: (see also “Advanced Editor” for the code)

     #"Added Custom" = Table.AddColumn(#"Changed Type", "Target Date", each {Number.From([Start date])..Number.From([End Date])}),
        #"Expanded Target Date" = Table.ExpandListColumn(#"Added Custom", "Target Date"),
    
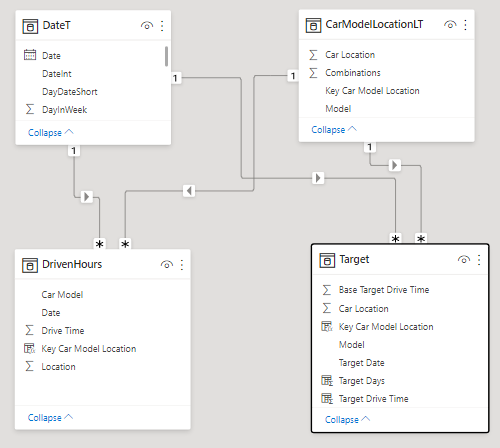
  2. Create one Lookup Table, including a unique Car Model Location key.

    Note: I have created the Lookup table in Excel, it is possible to create the Car-Model Location with DAX summarize, but then you need to be sure that the created table contains all locations and car models combinations. Recommendation: create them once manual.

  3. Create Keys in the Fact Tables “Target” and “Driven Hours” to be able to connect to the combined Car-Model Location lookup table (" Key Car Model Loc = [Model] & “-” & Target[Car Location] ")
    With the combined Car Model Location it becomes possible to filter the unique car model - location data.

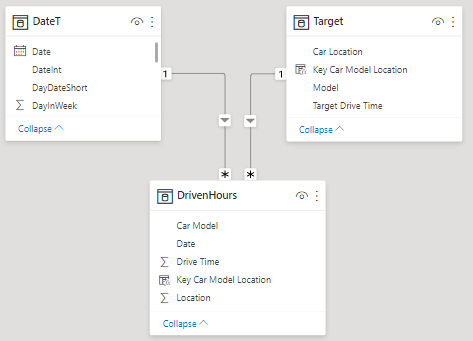
  4. Set up the data model (see below)
    image

  5. Exclude the weekend hours from the target, based upon a calculated column in the “Target” table, based upon “if Weekday [Date] = 1 or 7, 0, otherwise daily target”

  6. Given the preparation, two basic DAX sum-formulas with a difference calculation are sufficient to create the required reports

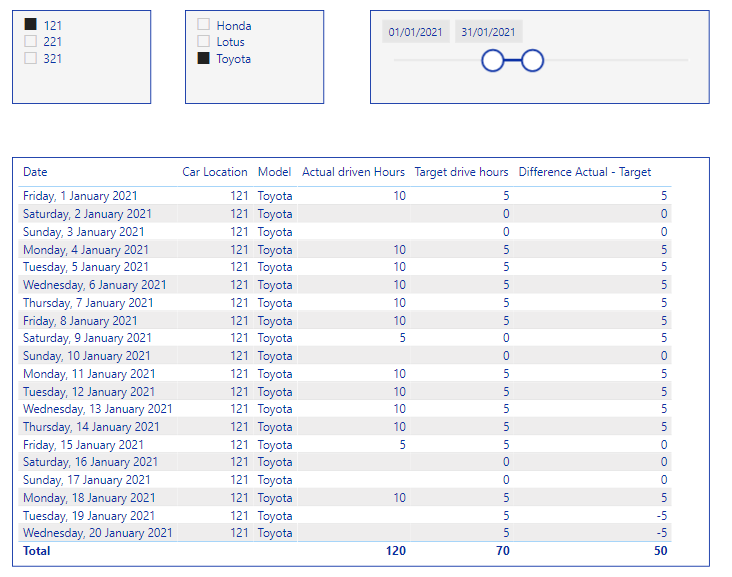
  7. An example report is shown below:

    (Note: when clicking on the date above the slicer, a month table pops up and it is possible to easily select a day.)

Question : do you really need the date range for the target ? It would be (much) easier to maintain a target per car model per location. Or are you comparing the planning with the actual hours driven ?

If you have further question or remarks, let me know.
Kind regards,

Thank you Jan @deltaselect, for such a detailed explanation.I don’t need to have a date range for the target. The source I have has that. I did replace the date range with hours per day for the target.
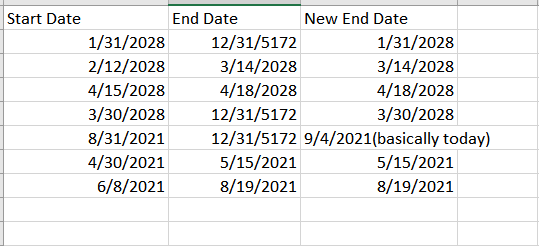
I was trying to implement your solution and I had few things that came up. I am yet to master M query, (would love to) but I have some dates that have a high date for the end dates.
image

How to handle this in power query as well as in dax? The query I have written in dax(if condition) doesn’t seem to work properly.
Newenddate= if([EndDate]=“12/31/5172”,Today(),if([StartDate]>Today() && [EndDate]=“12/31/5172”,[StartDate],[EndDate])
Is there anything that needs to be changed to get the required result?
Thank you.

Hi @Vsb79

Scenario 1 : No dates in the target

  • If no dates are needed, the target in this setting would dramatically increase, as the “Target Drive Time” will always be valid for every date, and not restricted to a certain time period ( for example Toyota at location 221 always have target 10, regardless the date).

    image

  • In this scenario the target would be (very) easy to maintain and implementation in PowerBI is very easy, see also attached PBIX:
    Car occupation (no dates in target).pbix (174.4 KB)

  1. Upload “ActualDrivenHours” and “Target” in Power Query, columns Start date and End Date could be removed from the Target table, no further modifications needed in Power Query

  2. Create in DAX the CarModel Location key as mentioned before to connect the tables.

  3. Create a data model as stated below:

    image

  4. The measure for the target would become:

    Target drive hours = 
    Var TargetDriveDays = CALCULATE( COUNTROWS( DateT),   //time slicer limits the days counted
                             FILTER( DateT, AND( WEEKDAY( DateT[Date]) <> 1, WEEKDAY( DateT[Date]) <> 7 )))
    return 
    SUMX( Target, Target[Target Drive Time]  *  TargetDriveDays)
    
  5. A possible report, showing the (significant) increase of the target, would be:

Scenario 2 : Target with dates, adjusting exceptional dates, and using the method with a daily target based upon a date range, as described two days ago

  • I recommend to adjust the dates with Power Query.

  • Reason is that only in Power Query the target is changed from a one line target with a date range , into a target per day on multiple lines, in my opinion Power Query is much better suited to do this then DAX.
    In order to be able to extend the target lines, first the dates have to be adjusted, another reason to do everything in Power Query.

  • As on request, the end date is changed to “today()”, when Enddate is 12/31/5072 and when the StartDate >Today() and the EndDate is 12/31/5172, then use StartDate, otherwise the EndDate.

  • As the target dates start in April, and the actual driven hours are in January, there is no Target in January.

  • The only change is made in Power Query, the previous presented model remains the same.
    PBIX file attached:
    Car occupation (strange date ranges adjustements in PQ).pbix (172.5 KB)

  • Used Power Query code is attached ( from Advanced Editor)

let
    Source = Excel.Workbook(File.Contents("C:\Users\User\Desktop\BI Power BI Enterprise DNA\x Forum respons\210901 car occupation\DateRangeHours (5).xlsx"), null, true),
    StrangeDateT_Table = Source{[Item="StrangeDateT",Kind="Table"]}[Data],
    #"Changed Type" = Table.TransformColumnTypes(StrangeDateT_Table,{{"Start date", type date}, {"End Date", type date}, {"CarLocation(RangeHrs)", Int64.Type}, {"Model", type text}, {"Target Drive Time", Int64.Type}}),
    #"Adjusted Target Enddates" = Table.AddColumn(#"Changed Type", "Adjusted End Date", each 
        if [Start date] > DateTime.Date(DateTime.LocalNow()) and Date.Year([End Date]) = 5172 
          then  [Start date] 
           else
             if [Start date] < DateTime.Date(DateTime.LocalNow()) and Date.Year([End Date]) = 5172 then   
                DateTime.Date(DateTime.LocalNow()) 
             else [End Date]),
    #"Added Custom" = Table.AddColumn(#"Adjusted Target Enddates", "Target Date", each {Number.From([Start date])..Number.From([Adjusted End Date])}),
    #"Expanded Target Date" = Table.ExpandListColumn(#"Added Custom", "Target Date"),
    #"Changed Type1" = Table.TransformColumnTypes(#"Expanded Target Date",{{"Target Date", type date}}),
    #"Sorted Rows" = Table.Sort(#"Changed Type1",{{"Target Date", Order.Ascending}}),
    #"Removed Columns" = Table.RemoveColumns(#"Sorted Rows",{"Start date", "End Date", "Adjusted End Date"})
in
    #"Removed Columns"

Target setting might need some thoughts (see the two options presented).

I hope it provides further insights, if you have further questions or remarks, please let me know.

Thank you so much for that very details response @deltaselect :slight_smile:

@Vsb79, good to see that you are having progress with your inquiry.

Did the response from @deltaselect help you solve your inquiry? If not, how far did you get and what kind of help you need further? If yes, kindly mark as solution the answer that solved your query.

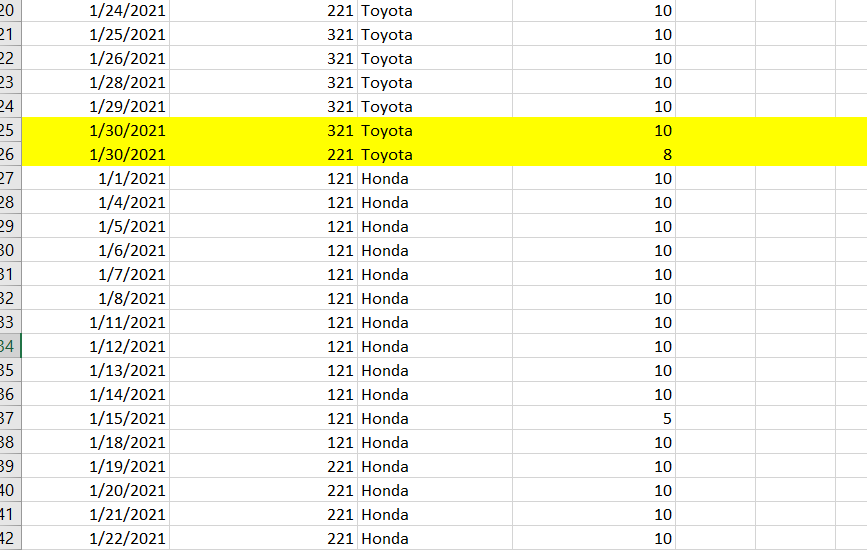
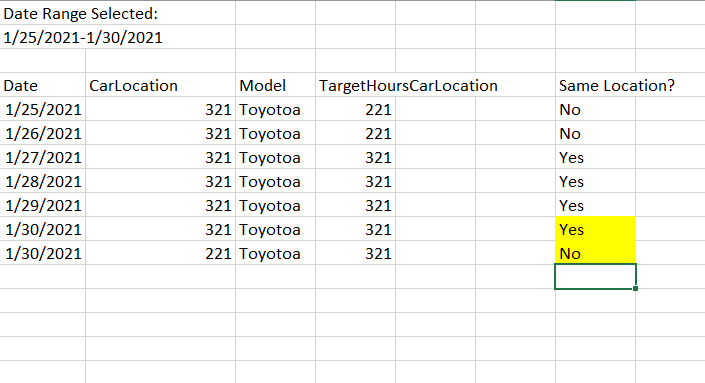
Thank you very much for the detailed response @deltaselect. I have started implementing this. I have one scenario where I have daily driven hours in two different car locations for the same car model for the same day. When comparing the locations between the daily car location and the target location,(which I need to track) there will be an exception where the car is in two different locations for the same day while the location from the target table has only one location. How do we handle such scenarios?


As of now, the report shows only one record for each day. In this scenario, while writing DAX, what should the changes be?

How does two records be pulled for the same day?

Appreciate your thoughts!

Thank you.

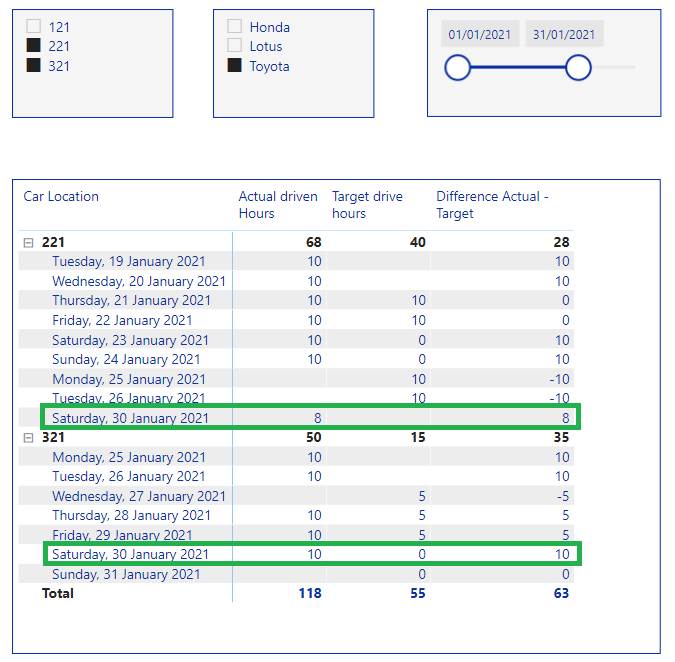
Not sure why the example of Toyota, having actual hours on 221 on 30 January, with no target would be any issue.
It could be presented as-is without any changes needed to the model, see picture below. It is on a Saturday, so the target would be zero anyway.
PBIX attached:
Car occupation v9.pbix (174.6 KB)

Hello @deltaselect , What is the purpose of the column Combinations in the CarModelLocationLT? You only use the Key Car Model Location for building the relationships between the tables. Is there a specific reason you created that column, and if so how is it created?
By the way, thank you so much for the detailed explanation of the solution. Appreciate it!

Thank you

Hi @Vsb79
Combinations has no important meaning, only it can sum the total car model - locations combinations, which also is possible with Countrows or Counta
Important are the key, the car model and the location, to be able to make selections. And this table has obviously to list all possible combinations.
Kind regards, JW

Thank you JW @deltaselect . Also, when using summarize, it only groups columns from one table. But when you have to group the columns from multiple tables, does summarize still work? Because when creating a lookup table with all models and all locations, I have to use columns from target table and driven hours table. Is there a work around for this?

Hi @Vsb79

Logic question.
A combined summarize should be possible, like:
==Summarize Driven Hrs for CarModel-Location,
==The same for Target,
==Union the two virtual tables
==Summarize the Union

Possible also Values will work, presumably can be done in one dynamic Lookup Table

Currently I have only access to my handy, no PowerBI not able to work this out next few days
You could try yourself or can make a new forum topic (or have patience)
KR JW

Thank you JW . I will try out your solution.

Hi @Vsb79

Presumably you have already solved your question: the summarize union works. The build-up of the lookup table from large real life tables might be slow, possibly a faster solution available.

Car occupation v10.pbix (180.0 KB)

CarModelLocationLT2 =
Var Actual2 = ADDCOLUMNS( SUMMARIZE( DrivenHours, DrivenHours[Key Car Model Location], DrivenHours[Car Model], DrivenHours[Location]), "DrivenHours2",1)
Var Target2 = ADDCOLUMNS( SUMMARIZE( Target, Target[Key Car Model Location], Target[Model], Target[CarLocation(RangeHrs)]), "Targethours2",1)
Var Union2 = UNION( Actual2, Target2)
Var UniqueUnion = ADDCOLUMNS( SUMMARIZE( Union2, DrivenHours[Key Car Model Location], DrivenHours[Car Model],DrivenHours[Location]),"UniqueCombis",1)
return UniqueUnion

KR JW

1 Like