Dax not working

Hi,
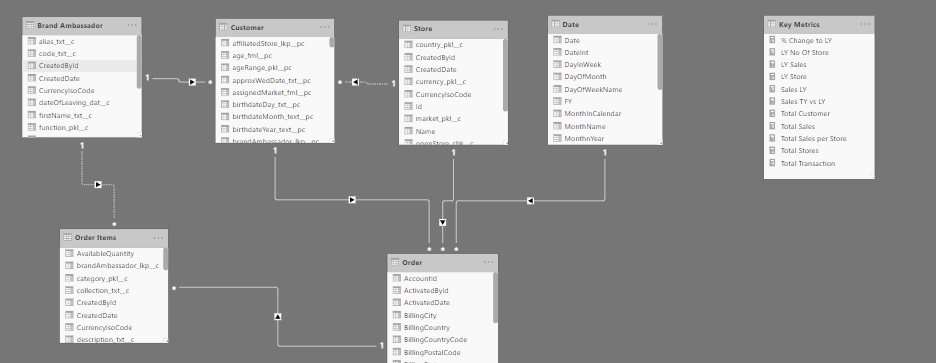
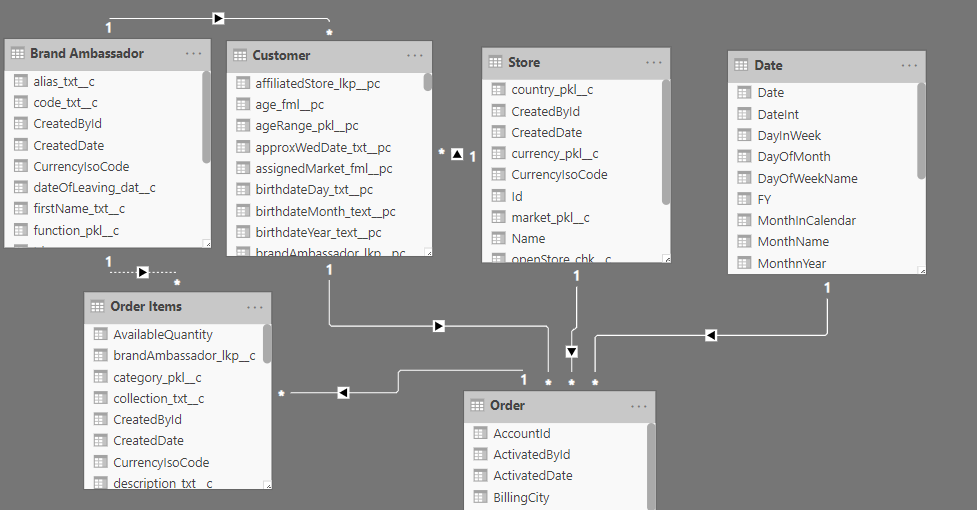
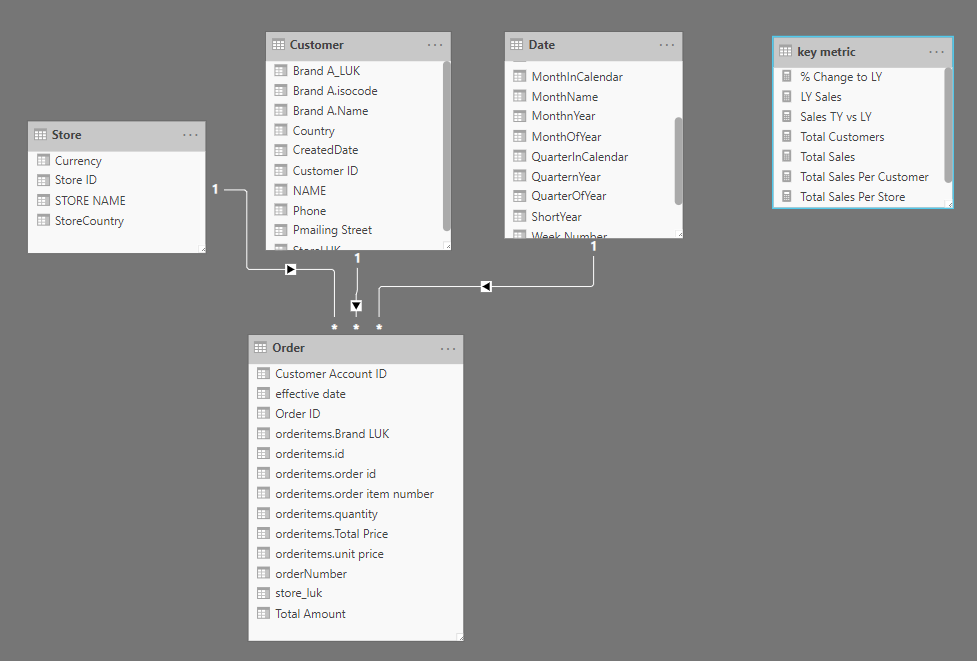
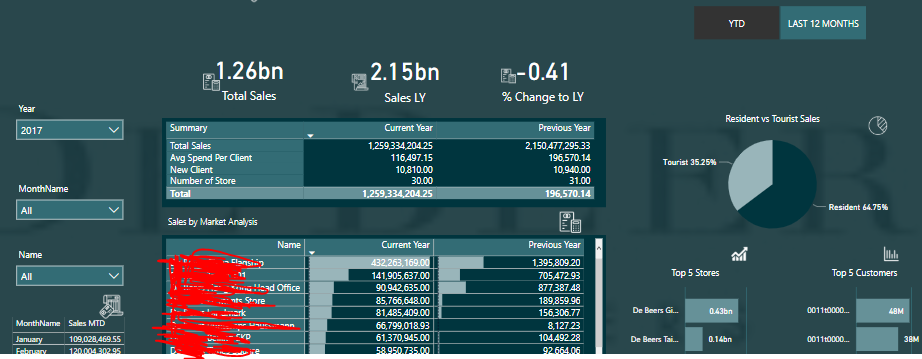
I have this model ( see pic attached ).
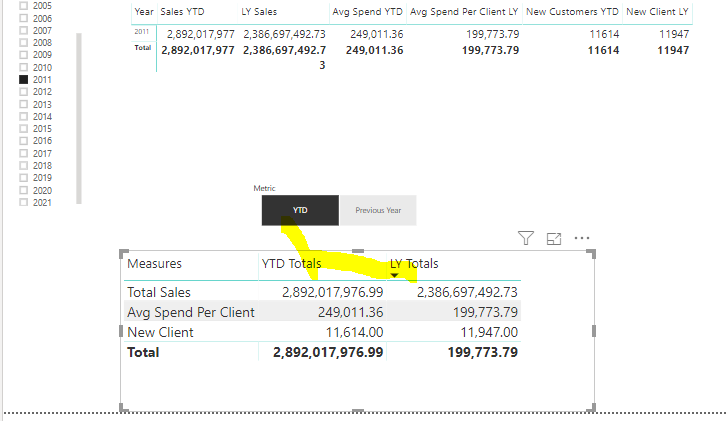
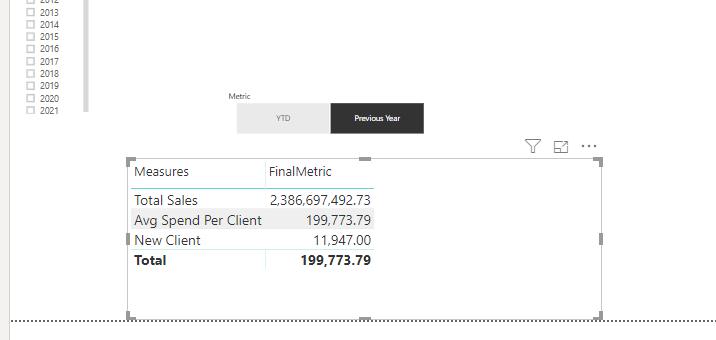
from this model , i need to generate more than 20 dashboards
however, i am trying to calculate the following as i am still new in this.

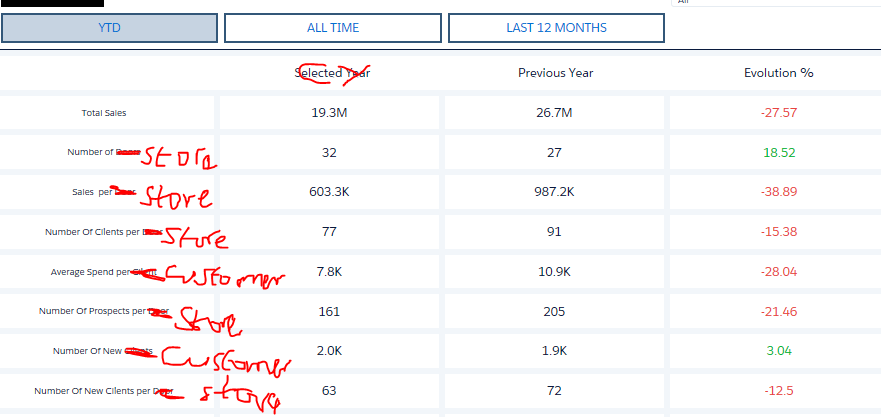
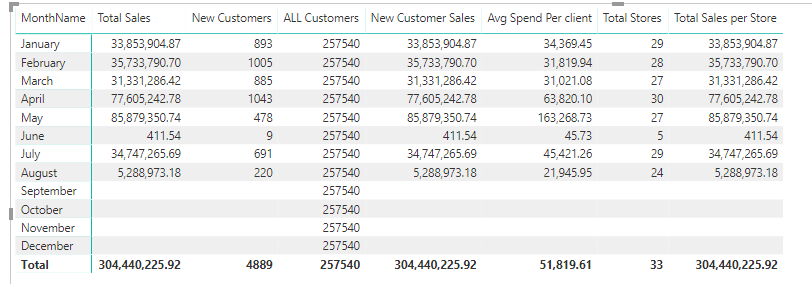
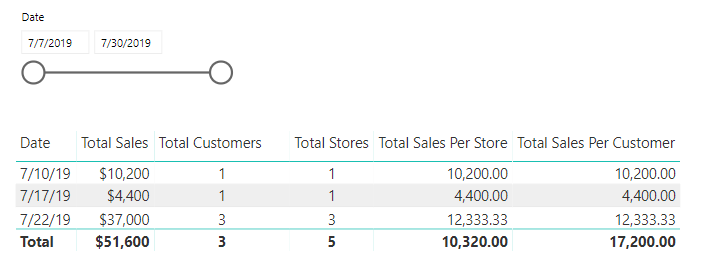
  1. Total No of Stores = DISTINCTCOUNT( Store[ID]) … But when i filter on the Year, Month, the value does not change, is there something am not doing well.

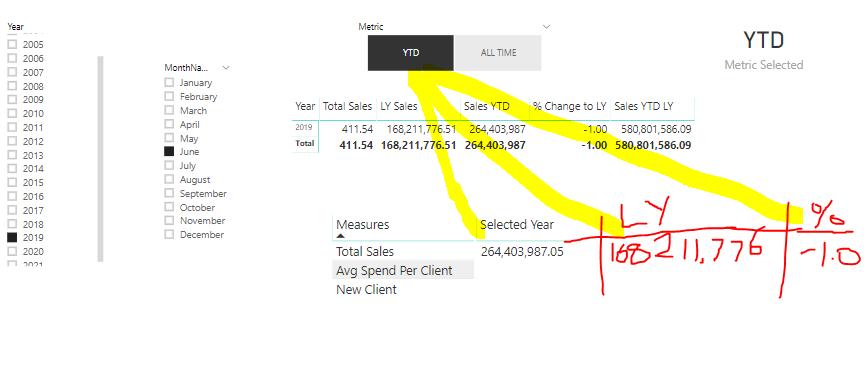
  2. LY Store = CALCULATE([Total Stores],DATEADD(‘Date’[Date],-1,YEAR)) : this means when the user choose a year filter, it should do a count of the store for the current filter year.

  3. Total Customer =
    DISTINCTCOUNT(Customer[Id]) : Again, this is simple but when i choose a filter, the numbers does not change based on the current filter. the ID is string and i need to count the number of unique customers that place an order as well

4… i also need to create number of prospect buyers who profile was created based on created date but did not purchase order

5.same as item 4 but within a selected month

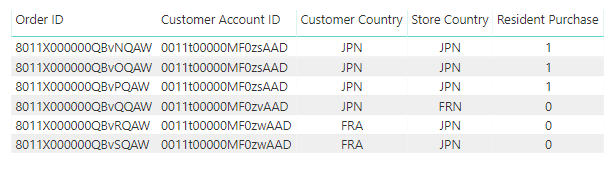
  1. i want to be able to know the number of customers who purchase items from within a store in his or country and also customer (tourist) who purchase goods outside his or her country where the store is not the customer country ( eg, customer A, lives in USA and purchase goods in a store in USA that is a local customer but if the customer purchase goods outside his country store then he is a tourist)

@alora101,

Typically, when even simple DAX measures aren’t working, it means there’s a problem with the data model. It’s a little hard to read your screenshot, but the fact that the Order fact table is on the “one” side of the one-to-many relationship, the relationships you have across dimension tables, plus whatever is going on with the Order Items table, indicates that your data model likely needs some significant rework. If you can please post the PBIX file, that will make diagnosing the problem a lot easier.

Thanks.

  • Brian

Hi Brian,

I try to share it but c

ould not, is there a way i can send it to you because the data are sensitive. The Orderline is Linked to the Brand Ambassador table which means a customer might purchase 5 times and each items or collections of items is linked to the Brand however, a customer also has a brand ambassador assign to him when his profile is created.

@alora,

Per @sam.mckay’s rules for the forum:

Going forward all support will occur on within this forum and will be for Enterprise DNA membership holders only. None will be completed over email.

Is there a way you can mask the sensitive data in your model (e.g., use Power Query to replace customer names with Customer 1, Customer 2, etc.) that would allow you to post the PBIX file? It’s really hard to tell what’s going on here without being able to look at the details of the relationships and dig into the data a bit.

Two other suggestions:

  1. If you haven’t already, definitely review the following series:
  1. Be sure to turn off the “Autodetect new relationships after data is loaded” option in PBI Desktop, and go through each of the relationships individually in your data model to make sure they are relating the correct fields in the proper direction. I find that autodetect feature is a menace - guessing (sometimes incorrectly) what the relationship should be, or adding one where it doesn’t exist. If I forget to turn it off, I actually delete all the relationships in the model and re-create them manually to make sure they are correct.

  • Brian

Thanks very much Brian

I have mimic exactly what i have on my power bi file. This attached file has the same IDs across.there are no difference with this file and the original apart from the data that has been modified

However, screen shot 1 is what i am trying to mimic in power bi.

CY vs Previous year across various measures ( on the left has the name of the measures). wondering if is possible to do same in power biTEST1.pbix (188.5 KB)

@alora101,

Great – the PBIX file and the mockup of what you’re looking for are both really helpful. I now have a good idea of what needs to be done here to fix the problems. I’ll work on this this evening after work and shoot to have something for you by tomorrow.

  • Brian

Hi,

These are my measures so far, will appreciate help

  1. Total number of store = CALCULATE(DISTINCTCOUNT( Store[Id]),‘Order’)

  2. Sales per store : This is sales that each store made = CALCULATE([Total Sales],ALLSELECTED(Store[Name])) --> This is bringing one value across all stores

  3. Number of Customer per store = This is customer who visited but did not buy any goods

  4. Avg spend by customer = total number of orders / by no of new client ( = divide(new customers sales, new customers,0)

  5. New Customers =
    VAR CustomerNew = VALUES(‘Order’[AccountId])
    VAR PriorCustomer = CALCULATETABLE( VALUES(‘Order’[AccountId]),
    FILTER( ALL(‘Date’),
    ‘Date’[Date] > MIN(‘Date’[Date]) &&
    ‘Date’[Date] < MIN(‘Date’[Date])))
    RETURN
    COUNTROWS(
    EXCEPT(CustomerNew,PriorCustomer))

New customer spend per store =
VAR CustomerNew = VALUES(‘Order’[AccountId])
VAR PriorCustomer = CALCULATETABLE( VALUES(‘Order’[AccountId]),
FILTER( ALL(‘Date’),
‘Date’[Date] > MIN(‘Date’[Date]) &&
‘Date’[Date] < MIN(‘Date’[Date])))
RETURN
CALCULATE([Total Sales],
EXCEPT(CustomerNew,PriorCustomer))

  1. ALL Customer sales =
    VAR CustomerNew = VALUES(‘Order’[AccountId])
    VAR PriorCustomer = CALCULATETABLE( VALUES(‘Order’[AccountId]),
    FILTER( ALL(‘Date’),
    ‘Date’[Date] > MIN(‘Date’[Date]) &&
    ‘Date’[Date] < MIN(‘Date’[Date])))
    RETURN
    CALCULATE([Total Sales],
    INTERSECT(CustomerNew,PriorCustomer))

  2. Customers who bought goods within a store in his country and also customers who bought goods outside his country as well? how do i calculate that

However, i wont also want to know customers who have bought more than one products or returning customers.

I am not too sure of the total sales per store and New customer spend should have the same figures . seen screen shot

Thanks Brian, You are a star.

@alora101,

Thanks very much for the additional measures information. I think the DAX will fall into place pretty easily once the data model is in order.

  • Brian

Hi Brian,

i am trying to mimic the application dashboard using Power BI, However, i have created a simple table with the measures names , then drag it close to the dynamic measure i created to look exactly like what they have .

My problem now is

  1. how do i make the YTD File to control the selected Year( CY ), previous year (LY) and the evolution at the same time

  2. how can i include in the YTD Dynamic measure to do same in all measures so all works dynamically.

see screen shot and also see the sales sheet attached.

Sales.xlsx (12.6 KB)

@alora101,

OK, spent some time reviewing your model and data, and here are the changes I made:

  1. in the Data view, right clicked on your ‘Date’ table and selected “Mark as date table”. This is critical for getting any time intelligence measures to work correctly.

image

  1. Renamed your ID fields more specifically (e.g. Customer ID, Store ID, etc.) to make it easier to identify the proper relationships between tables

  2. Eliminated the relationships between your dimension tables. These relationships are unnecessary, and were creating ambiguity in the model that was preventing you from creating an active relationship between your Customer and Order table - a critical relationship for filtering.

  3. Merged Brand Ambassador information with Customer table. You indicated that a single brand ambassador is assigned to a customer when the customer record is created. Therefore, it seems to make sense to treat BA as an attribute of Customer.

  4. Merged Order and OrderItems tables. Both of these tables provide information on customer orders and are linked by the order ID number. Therefore it made sense to merge them into a single fact table. The result of all this is the following greatly simplified star schema:

There’s not enough data in your sample file to test the time intelligence measures, but all the other measures below seem to work perfectly, and I think you’ll find that with revised data model, the additional DAX measures are much simpler and more intuitive to develop.


Give this a go, and if you have any questions or problems just give a shout.

  • Brian

Full solution file: eDNA Forum Alora101 data modeling and DAX.pbix (180.4 KB)

@alora101,

Re: your most recent question tonight, I think you’ll find the following video very helpful:

  • Brian

Thanks Brian,

I have done the merge using inner join.

One strange thing, in the customer table, i have 13,600 rows and unique customers but when i write a simple distinctcount (customer[id]) i get 14,000 customers… any reason why?

Can you help with the logic of customers who live in a country and purchase goods in the same country pleassssssse.

Thanks

Hi Brian,

Thanks again for this. Please you will need to be patient with me as i have so much to learn and ask at the same time.

I have followed the tutorial however, got stock in the last part, where Sam did create the various quarter measures, i tried it and nothing came out even downloaded the file still cannot make sure of it.

so what i really want it Once i click on YTD, i want all measures to change and once i click on Previous year and measures should re-calculate.

So my question now is:

how do i link the two measures to any of the dynamic filter see below screen shot

see below calculation based on what Sam did but i broke it down

LY Totals =
VAR CurrentItem = SELECTEDVALUE( ‘Logic Table’[Measures] )

VAR LastYear = SWITCH( TRUE(),
CurrentItem = “Total Sales”, [Sales LY],
CurrentItem = "Avg Spend Per Client ", [Avg Spend Per Client LY],
CurrentItem = “New Client”, [New Client LY],
CALCULATE( [Avg Spend Per Client LY], FILTER( ‘Logic Table’, ‘Logic Table’[Measures] = CurrentItem ) ) )

RETURN
LastYear

YTD Totals =
VAR CurrentItem = SELECTEDVALUE( ‘Logic Table’[Measures] )

VAR Actuals= SWITCH( TRUE(),
CurrentItem = “Total Sales”, [Sales YTD],
CurrentItem = “Avg Spend Per Client”, [Avg Spend YTD],
CurrentItem = “New Client”, [New Customers YTD],
CALCULATE( [Total Sales],
FILTER( ‘Logic Table’, ‘Logic Table’[Measures] = CurrentItem ) ) )

RETURN
Actuals

However, when i follow the exercise as Sam, and use the filter it works but how do i split it based on the requirement ? however the one above is exactly what i needed because i need two columns a) CY and b) Previous Year.

In the above that i did, once i click on YTD, Column A should calculate the current year to date while column be will calculate the previous year YTD base on the current month…

My biggest problem is how to connect the two dynamic measure created above to link with the filter

@alora101,

Given that under the new data model, we now have an active relationship between the Customer and Order tables, evaluating resident versus tourist purchases becomes much simpler. I suggest doing this as a calculated column in your Order table:

Resident Purchase = 
    IF(
        RELATED( Customer[Country] ) = RELATED( Store[StoreCountry] ),
        1, 0
    )

image

I’m not sure what is going on with your table join, but based on my understanding of the relationship between Customer and Brand Ambassador, I think it should be an outer join with the customer table on top when you do the merge. Try that, and see if it resolves the issue.

Hope this is helpful.

  • Brian

I think i have solved this issue, I created another table to hold the two dynamic filter and then create another switch. I will come back to this, let me create some measures and if it works then happy days.:slight_smile:

@alora101,

Great – sounds like you’re on a good track.

Good luck!

  • Brian

Hi Brian,

Thanks very much for your help.

I am waiting for the business to give a go ahead to start working on the rest dashboards,

The dashboard am working on are designing currently using .net so i have to represent all in power bi and i think so far so good, i have done some nice job but THANKS to you.

That is one among the three i design.

@alora101,

Thanks very much for the update. Dashboard is looking great, and it looks like you’ve got the YTD/Last 12 Months measure switching working well.

Glad I was able to assist - enjoyed working with you on this.

Good luck with the remainder of the project.

  • Brian
1 Like