Dear EDNA Experts,
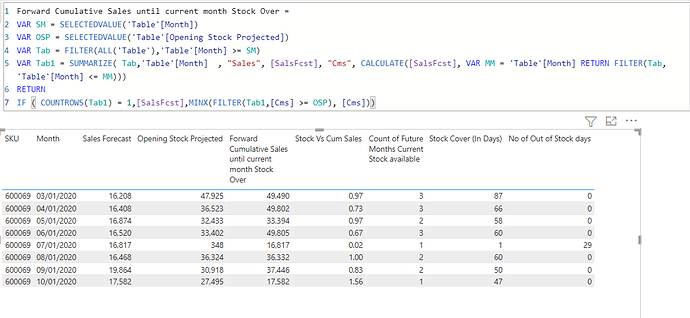
I am finding difficult to calculate Days of Forward Stock Cover in DAX. I have Sales forecast and Projected Opening Stock as inputs for this calculation.
I made manual excel calculation for this, not able to get this in PowerBI with DAX.
| SKU | Month | Sales Forecast | Opening Stock Projected | Forward Cumulative Sales until current month Stock Over | Stock Vs Cum Sales | Count of Future Months Current Stock available | Stock Cover (In Days) | Safety Stock Days (Target) | No of Out of Stock days |
|---|---|---|---|---|---|---|---|---|---|
| 600069 | 01-Mar-20 | 16208 | 47925 | 49490 | 0.97 | 3.00 | 87 | 30 | 0 |
| 600069 | 01-Apr-20 | 16408 | 36523 | 49802 | 0.73 | 3.00 | 66 | 30 | 0 |
| 600069 | 01-May-20 | 16874 | 32433 | 33394 | 0.97 | 2.00 | 58 | 30 | 0 |
| 600069 | 01-Jun-20 | 16520 | 33402 | 49805 | 0.67 | 3.00 | 60 | 30 | 0 |
| 600069 | 01-Jul-20 | 16817 | 347.5 | 16817 | 0.02 | 1.00 | 1 | 30 | 29 |
| 600069 | 01-Aug-20 | 16468 | 36324 | 36332 | 0.9998 | 2.00 | 60 | 30 | 0 |
| 600069 | 01-Sep-20 | 19864 | 30918 | 37446 | 0.83 | 2.00 | 50 | 30 | 0 |
| 600069 | 01-Oct-20 | 17582 | 27495 | 17582 | 1.56 | 1.00 | 47 | 30 | 0 |
Taking 01-Apr-20 as example, Opening Stock is 36,523. This stock will get exhausted in early June ( 16,408 + 16,874 + 16,520 = 49,802 cumulative sales forecasts) which results in forward stock cover days as 66days during Apr’20.
Similarly this can be dynamic for any month.
Thanks In advance.
Stock Cover days Calculation.xlsx (12.4 KB)
Regards
James

 .
.