Hi All
I need to help in creating an alert based on the below table Logic 1.pbix (24.5 KB)
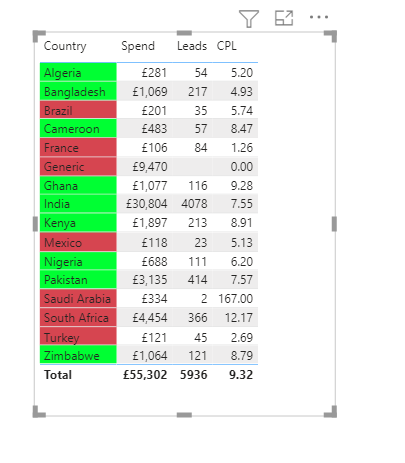
Row Labels
Spend
Leads
CPL (Spend/Leads)
India
£ 30,804
4078
£ 7.55
Generic
£ 9,470
#DIV/0!
South Africa
£ 4,454
366
£ 12.17
Pakistan
£ 3,135
414
£ 7.57
Kenya
£ 1,897
213
£ 8.91
Ghana
£ 1,077
116
£ 9.28
Bangladesh
£ 1,069
217
£ 4.93
Zimbabwe
£ 1,064
121
£ 8.80
Nigeria
£ 688
111
£ 6.20
Cameroon
£ 483
57
£ 8.47
Saudi Arabia
£ 334
2
£ 166.88
Algeria
£ 281
54
£ 5.20
Brazil
£ 201
35
£ 5.74
Turkey
£ 121
45
£ 2.69
Mexico
£ 118
23
£ 5.13
France
£ 106
84
£ 1.26
If my spend is >200 and my leads are >50 and my CPL is below 10 then it should be shown as GREEN and anything >10 should be shown as RED
Appreciate your help here
Hi @Nagi_k, we aim to consistently improve the topics being posted on the forum to help you in getting a strong solution faster. While waiting for a response, here are some tips so you can get the most out of the forum and other Enterprise DNA resources.
Use the forum search to discover if your query has been asked before by another member.
When posting a topic with formula make sure that it is correctly formatted to preformatted text </>.
Use the proper category that best describes your topic
Provide as much context to a question as possible.
Include the masked demo pbix file, images of the entire scenario you are dealing with, screenshot of the data model, details of how you want to visualize a result, and any other supporting links and details.
You mentioned alerts in the post. Did you want to use gauge, kpi or card visual to use Power BI alerts?? or were you referring to conditional formatting??
I assumed conditional formatting. If you need an alert, please do let us know.
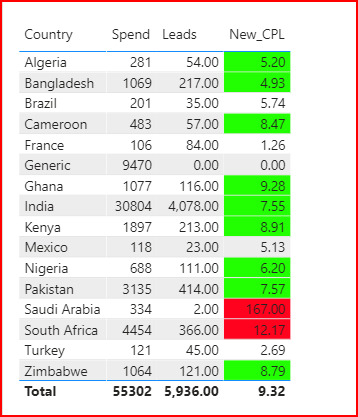
@AnshP infact this is what i was looking , 5.74 is not showing anything is it bcoz Spends are >200 and leads are <50 there will be no result (will not be in Red and will not be in Green)
As we are applying logic only for Spend >200 and leads >50.
Can you explain how this conditional formatting applied
you need to have a numeric field (in straightforward terms). So I added a measure to check for your conditions (you have 3 particular[Nagi_sol.pbix|attachment](, and if they are satisfied, then assign the said measure a value, say 1, else 0.
Now when you look at rule-based conditional formatting, you can then use the above measure.
I have included the pbix here. Let me know if you need more clarification.
Happy to do that
Thank you so much, i have a small problem, for finding spends i have written a Dax measures and finding leads i have created a cal. column.
I have attached sample file of it in drive since my file is big . If we have DAX then how can we write dax to measure this. https://drive.google.com/file/d/1KklAL-SC86T3m36qkR4iH1M1w5fUplTP/view?usp=sharing
I requested access to your one drive as I could not access it. But overall, the rule of thumb is to minimize the usage of Calc Col as much as possible. Once I get access to it, I will look into the sample file and send over my inputs.
Cheers!
I got it , i have done it …Thank you for the inputs.
For example : Similarly i have 2 created logics for the same table 1 for CPL and CPA else and based on the 2 logics can we create 1 more logic.
for suppose ,
1.Logic 1 is Green and Logic 2 is Green can we can create a alert saying this is ok
2.Logic 1 is Red and Logic 2 is Green can we create a alert saying this is not ok to be reviewed
3.Red and Red not to proceed
4. Green and Red not ok to be reviewed
Kudos to you. This is a neat trick and always works when working with conditional formatting.
As far as your second question is concerned, have a look at the image below.
Based on your data, you can easily create a measure for Lead (without a cal col)
The trick here is to use Calculate to show the right sum(aggregation) based on your context.
I hope this helps!!!