Hello - I need help to correctly classify our sales for commission calcs. The execs want to reward sales made to “New” customers and “New” product lines. They define new as being 12 months from the date of the first sale of that customer for that product line (there are 5 prod lines). All sales after the initial 12 months is to be tagged as existing.
My idea was to write DAX to create a results table which considers the “Product” of the item and the “Account Ref” of the customer and returns the first date that a transaction appears for that combination in the revenue transactions table.
From these date starting points I can then work out 365 days after which will then allow me to compare the sales date to this start and end date and add a column to my revenue table for either
- if it is equal to or within the date range it will be classified as “NEW” (business)
- if it is after the date range it will be classified as “EXISTING” (business)
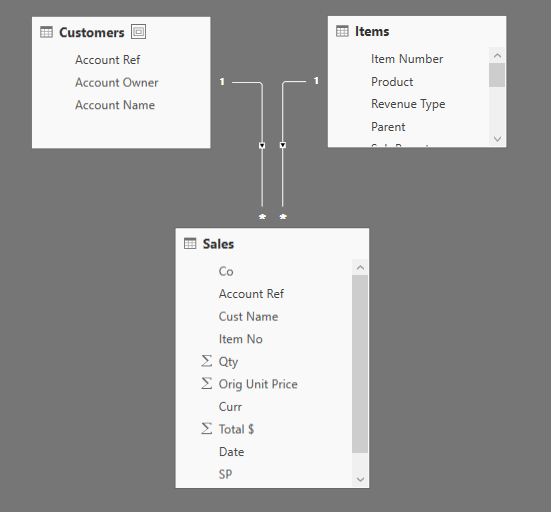
NB - Sales in my model are linked to items by item number and to customers by account ref
Does that make sense?
This is what I have tried so far…
Results = ALL(DimSFCustomers[Account Ref])      _This created me a one column table_

Account Name = LOOKUPVALUE(DimSFCustomers[Alias], DimSFCustomers[Account Ref], [Account Ref])    _This succeeded in getting the account names into column 2_

Start Date = CALCULATE(MIN('2 Revenue'[Date]),
      FILTER(RELATEDTABLE('2 Revenue'),'2 Revenue'[Account Ref] = 'Results'[Account Ref]))
_This returned the first date for that customer but I don't know how to add the extra filter for item product_
So now I am stuck and hope someone can help.
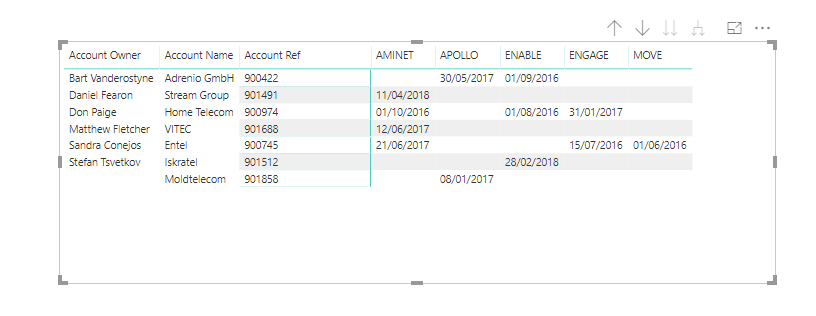
I have attached a workbook showing how I imagined the results table would look and the column of “new/existing labels” for the revenue table.
Many thanks Lizzie
DAX Problem for DNA.xlsx (16.7 KB)
This is a very interesting one. I’ll see if I can mock something up for you.
The first thing I believe here is that you want to re-think this.
It looks like you’re trying to create a table using calculated columns.
I don’t think you need to do this at all. You can complete this all with measures.
The technique we are after here is attrition analysis. I’ve covered this a little bit and we’ll be working around a technique that follows a similar pattern.
Here are some links to review around the technique.
See below I’ve re-created that results table very simply with the model and a simple formula
First Sales Date = FIRSTDATE( Sales[Date] )
You also don’t really need this column
We will look to work this all out virtually.
The big question is how do you actually want to show this.
By dates, customers, products. The end visualization matters here a lot because that’s what we adjust the context of the calculation and we need to work around this.
By dates makes sense, so a date table is required.
This is where I’m at right now
But I really need to understand how you want to showcase the results I think.
That quite important as the measures could be very different.
Let me know.
Latest attached
New customers per product.pbix (160.5 KB)
Note from Lizzie:
Hi Sam
This is fab, happy to use measures, in fact happier as it keeps my data neater.
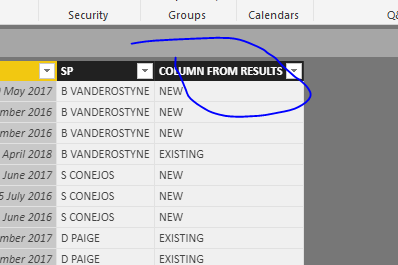
I think the output I am looking for is some sort of dynamic tag against each sales transaction. For example an invoice dated today for a brand new customer would show as NEW and the commission rate of 2% would be applied.
If fast forward one year and a second invoice for the same customer and same product line (i.e repeat business) was raised then the tag would be Existing and the commission rate of 1% gets applied.
We need to show the commission calcs against each sales invoice so the team can check the workings for themselves.
I was thinking of a calc column on the revenue table so I could also use NEW and EXISTING “tags” as a filter on sales team performance visuals. The key objective is really getting the commission calcs right.
Does that help? I haven’t looked through the attachment s or the attrition analysis yet (as I am just still in bed  - can’t believe your turn around time) but today I will and I am sure your guidance will give me enough to get this sorted.
I’ll let you know how I get on, incredible support service, thank you.
Lizzie
Ok see how you go with this.
I’ve thought about it for a while and created something a little more dynamic that you should be able to have a play around with.
Everything is with DAX measures.
Total Sales = SUM( Sales[Total $] )

First Sales Date =
IF( NOT( ISBLANK( [Total Sales] ) ), CALCULATE( FIRSTDATE( Sales[Date] ), ALL( Dates ) ), BLANK() )

Commission Rate =
VAR FirstSalesDate = [First Sales Date]
VAR DaysSinceFirstSale = VALUE( MAX( Dates[Date] ) - FirstSalesDate )

RETURN
IF( ISBLANK( [Total Sales] ),
    BLANK(),
        IF( DaysSinceFirstSale <= 365, 0.02, 0.01 ))
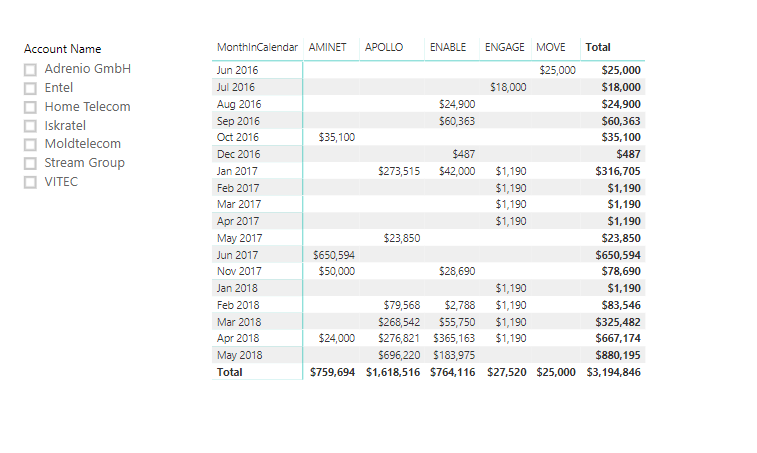
I’ve looked to step it out in the example below
Commision rates are on the far right.
This calculation is a dynamic one, so as more sales come in you can automatically filter by a customer and see quickly which commision they would receive.
Have a look through this and see if this is what you need.
Have a play around and look to understand how I’ve completed it.
Attached
New customers per product.pbix (170.1 KB)