DAX Help - Forecast & Actuals on Same Table (Dummy Data)

Hello All,

It would be greatly appreciated if I could get some advice on my DAX calculations – in showing forecast & actuals on the same table (for a non-standard calendar table).

Source data is weekly but I have rolled this up to monthly periods and set up the below DAX calculations based on a custom Dates table.
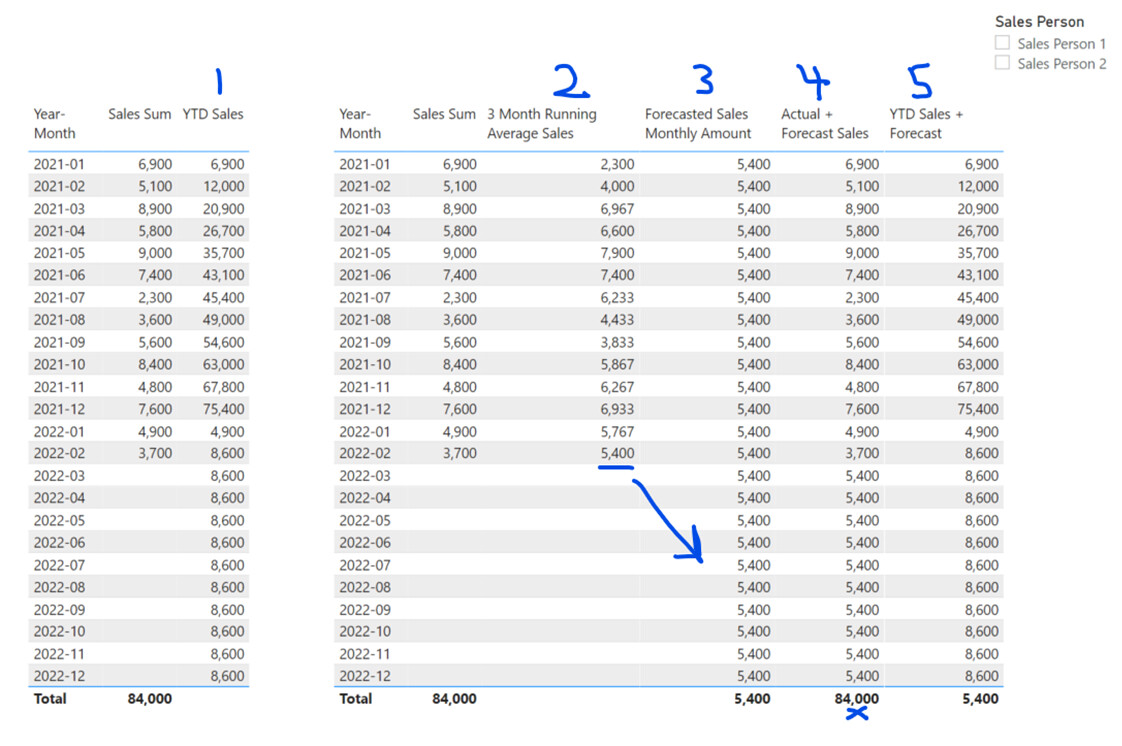
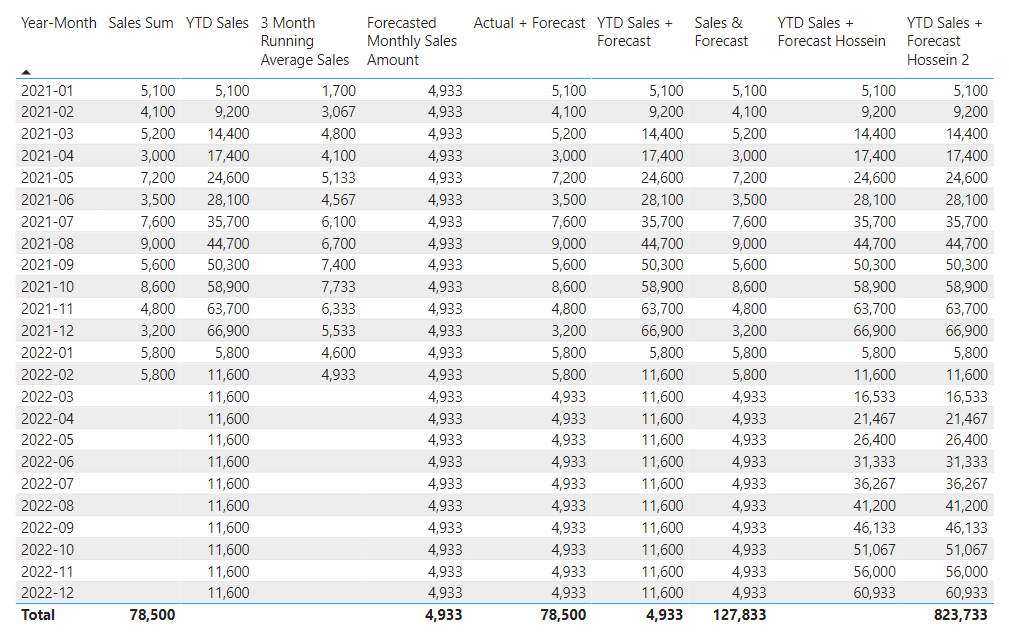
Numbers in visual:

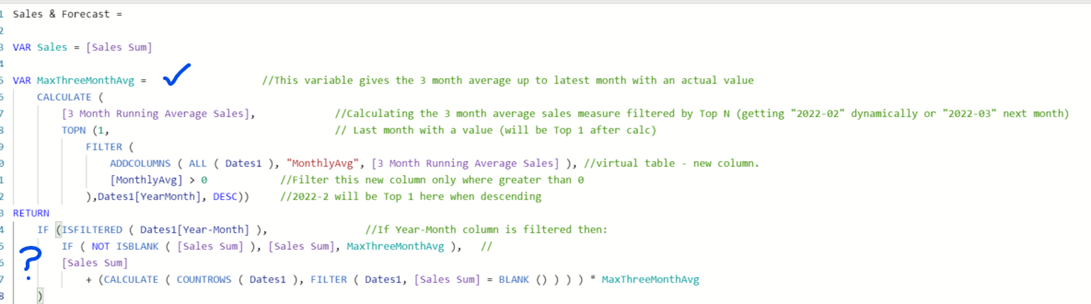
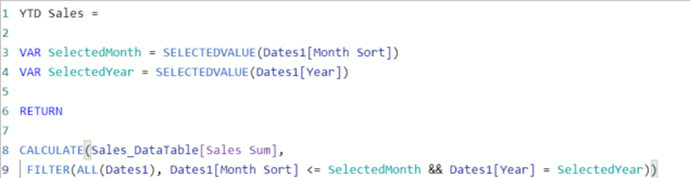
  1. As the Time Intelligence functions don’t work, I used the below calculation which does work for YTD Sales:

image

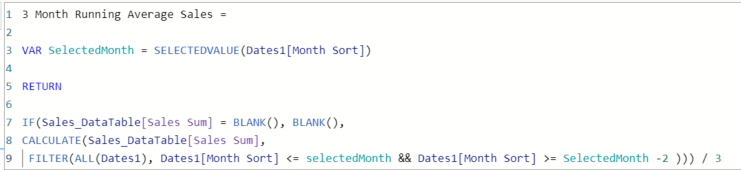
  1. 3 month running average based on actual Sales:

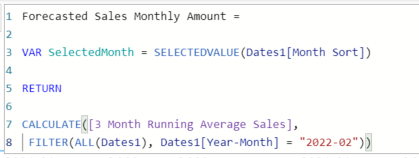
  1. I based the forecast monthly Sales amount on the latest available 3 month average e.g. $5,400 (but I can tweak that afterwards with parameters after I get the basics right). There may be a better way to do this – attached may not be best practice e.g. no table functions used…

image

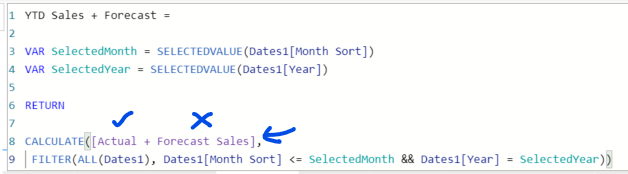
  1. Added actuals + forecast values (if actuals were blank).

image

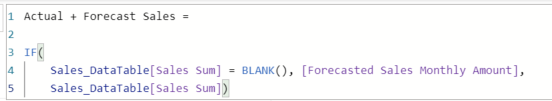
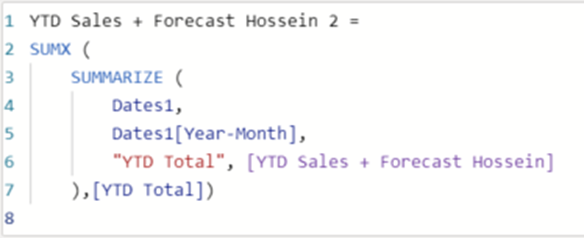
  1. Unfortunately, this is where my major issue is – the original YTD Sales calculation does not seem to work on this column. It still adds the cumulative actuals and ignores forecast figures. Any advice on how I could get actuals + forecast and a YTD figure up to end of 2022 would be greatly appreciated.

image

Any other tips would be welcome also!

Thank you!

@R123_Fin
Thanks for posting your query. Can you please attach your pbix file, so that we can take a look at the DAX formula?

Thanks @sedhosen - any advice would be greatly appreciated or if I should approach this differently entirely.
Dummy Data PBI - Forecast.pbix (34.7 KB)

Please see attached pbix file.

Thanks,

Please find below what I’ve done to calculate the measures. First I recreated the “Actual + Forecast” measure named as Sales & Forecast:

Sales & Forecast = 
VAR Sales = [Sales Sum]
VAR MaxThreeMonthAvg =
    CALCULATE (
        [3 Month Running Average Sales],
        TOPN (1,
            FILTER (
                ADDCOLUMNS ( ALL ( Dates1 ), "MonthlyAvg", [3 Month Running Average Sales] ),
                [MonthlyAvg] > 0
            ),Dates1[YearMonth], DESC))
RETURN
    IF (ISFILTERED ( Dates1[Year-Month] ),
        IF ( NOT ISBLANK ( [Sales Sum] ), [Sales Sum], MaxThreeMonthAvg ),
        [Sales Sum]
            + (CALCULATE ( COUNTROWS ( Dates1 ), FILTER ( Dates1, [Sales Sum] = BLANK () ) ) ) * MaxThreeMonthAvg
    )

then recreated the YTD measure using the following formula, but the problem is that you can’t get any total value.

YTD Sales + Forecast Hossein = 
VAR SelectedMonth =
    SELECTEDVALUE ( Dates1[Month Sort] )
VAR SelectedYear =
    SELECTEDVALUE ( Dates1[Year] )
VAR Result =
    SUMX (
        FILTER (
            ALL ( Dates1 ),
            Dates1[Month Sort] <= SelectedMonth
                && Dates1[Year] = SelectedYear
        ),
        [Sales & Forecast]
    )
RETURN
Result

So, you need to create another measure to get the total value. Using the below measure you will receive the Total Value:

YTD Sales + Forecast Hossein 2 =
SUMX (
    SUMMARIZE (
        Dates1,
        Dates1[Year-Month],
        "YTD Total", [YTD Sales + Forecast Hossein]
    ),[YTD Total])

You can see the result in the following image:

Dummy Data PBI - Forecast.pbix (43.5 KB)

Hope it helps you to get what you want,
Regards,
Hossein

1 Like

Thanks @sedhosen - thank you so much for taking the time to write such a comprehensive reply. Your analysis will greatly help me and reviewing the mechanics of your DAX calculations will also hopefully improve my own skills.

Thanks again!

1 Like

Happy to hear that it helped you :blush:

1 Like

This really is fantastic @sedhosen – thank you so much for this. I have been playing around with creating the virtual tables within these DAX to see them visually – great help in me learning to use tabular functions more often!

Just a couple of final queries if you get a chance at some stage.

For the “Sales + Forecast” Measure, I understand the VAR “MaxThreeMonthAvg” part of the calculation, but would you mind explaining what is happening under under the RETURN line?

Also, I created the SUMMARIZE virtual table below separately to see how it looks visually. For my own understanding – you included this table within the first argument of SUMX and then noted the newly created [YTD Total] being the expression of YTD Actuals + Forecast. This allows the creation of a subtotal. Just to ask, why doesn’t the total show under the “YTD Sales + Forecast Hossein” Measure (for my own learning more than anything)?

image

Thanks again!

1 Like

Regarding the “Sales + Forecast” measure and RETURN part:

  • first of all, I check if year-month is filtered, so that I can distinguish between the table rows and the total row.

  • Then at the second line, check if the [Sales Sum] measure is blank so that I can distinguish between the rows that have values under the [Sales Sum] column and the rows that are blank.

  • If the row is NOT blank, I would like to see the [Sales Sum] value, if it is, I would like to multiply the MaxThreeMonthAvg by the number of blank rows. The calculate statement at the final line is to calculate the number of blank rows.

Regarding your second question,
sometimes when you are creating a measure, you know that you have a filter context like Year-Month in the table. So you utilize this feature when you are using CALCULATE function or FILTER functions like ALL, ALLSELECTED, VALUES, and so on. Although you will get the correct result for each row, it doesn’t mean it also gonna work for the total row (where you don’t have that filter context that you did count on). So one of the best ways to solve this issue is to define a new measure considering that you don’t have that filter context anymore.

Highly recommend you to see the below video:

Regards,
Hossein

1 Like

Thanks again @sedhosen . I greatly appreciate this detailed response and explanation. I also watched the recommended video and I now fully understand the workaround for the individual table row context and the total row context. Thanks again for your time and assistance here. I didn’t realize how useful this Forum was until now. I’m looking forward to improving my Power BI skills as the year progresses on Enterprise DNA!

1 Like