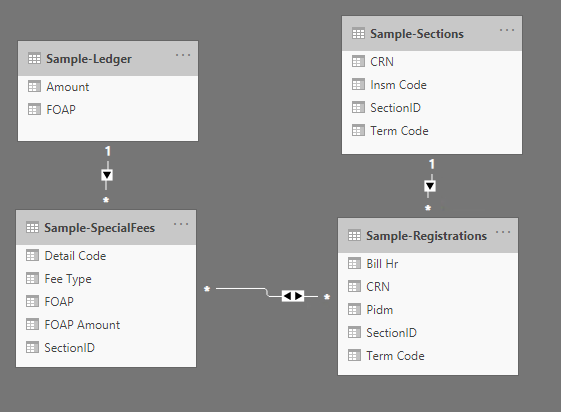
I have a work project that I know can be handled in a much simpler method than I’ve been using. As such, the whole thing is so complicated I don’t know how to provide a sample file. Below is a graphic showing simplified tables and relationships.
Basically, what I’m wanting to accomplish is build a measure named “Online Amount” involving the steps below:
Multiply Sample-Registrations[Bill Hr] * Sample-SpecialFees[FOAP Amount] where [Sample-SpecialFees[Detail Code] = “2401” and Sample-Sections[Insm Code] = “ECBOL” and Sample-SpecialFees[SectionID] = Sample-Registrations[SectionID]
I’m thinking I need to use SUMX to get the total of multiplying the [Bill Hr] * [FOAP Amount] and TREATAS to join the two [SectionID] fields, but can’t figure out the way to write a DAX formula to accomplish all this.
I will have other more involved calculations to use for other measures since some will need to do the above multiplication where the [Fee Type] field = “BILL” or just bring in the [FOAP Amount] where the [Fee Type] field = “FLAT”. They will also reference various other fields (not shown) in Sample-Sections. But I believe if I can get help in writing the formula for the details I mentioned above I will then be able to use variations to build the other measures I will need.
I appreciate any help. Sorry I can’t provide an example of my file as the whole project references dozens of Oracle data tables.
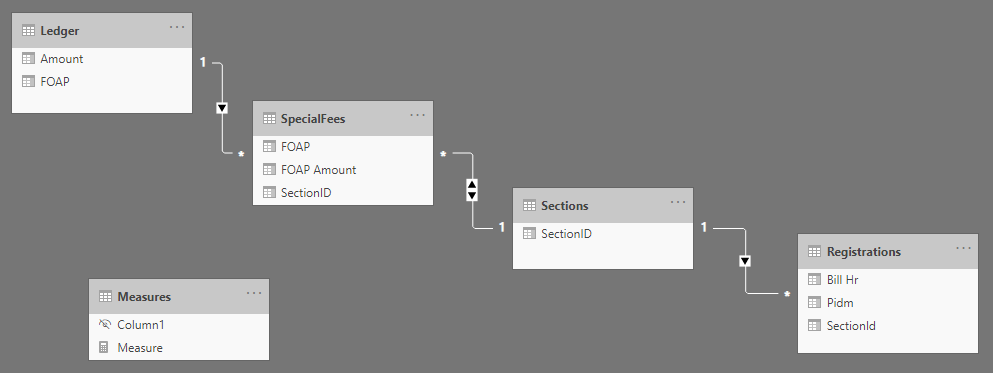
Create a bridge table between SpecialFees and Registrations that filters both the table using 1: many relationship so that you don’t have to use many to many relationship. And then it will be easier to create measures
After looking at your model i have a small piece of advice that this model is not an efficient model reason being the use of Many to Many Relationship. However, I would advice you to provide some sample data in excel e.g put these table in different sheets and fill each sheet with some sample/random data and we can help you in building a model which you can follow for your future projects too. Yes, we will help you in writing this measure too.
Thanks. I tried to build a bridge table containing only the SectionID and got the one to many relationships between SpecialFees and Registrations, but then couldn’t figure out how to reference the desired fields from both tables incorporating it. I’m sure once I see it I will be amazed at how simple it is, but for some reason this one thing has baffled me.
Without a full understanding of the project, or a sample pbix file, this is tricky to give good advice here.
In my experience with pulling data from SAP, I’d go back to fundamentals and review the data model.
Looking at your original post, it would seem the ‘Sample-Registrations’ is your fact table, and the rest are dimensional. (Or possibly all the tables are dimensional???) However, the relationship between ‘Sample-Registrations’ and ‘Sample-SpecialFees’ is incomplete; presuming [SectionID] is the column you’re currently using for the relationship.
I’d go back and identify the true relationship between these tables. It may involve other intermediary tables; in which case you should try and de-normalise the tables and create a star schema.
The problem with your current setup, even if you get the DAX partially working, is it looks like a given [Bill Hr] can have multiple [FOAP Amount] values; in which case, which [FOAP Amount] value one do you multiple [Bill Hr] by?
Again, without a full understanding of the project, or a sample pbix file, this is tricky to give good advice here.
Thanks. Yes, I understand it is hard to grasp without seeing. When I’m back at work next week I’ll try to put together a sample I can upload. It struck me that the Sections file I showed is actually a bridge between the Special Fees and Registrations, but I have a tendency to focus on the Registrations as the charges for each student in a class can vary based on their residency, number of hours taken (if a variable credit class), and other factors.
The Sections file is a fact table that contains one record per class, using the Section ID as the key. The Section ID is a concatenation of two fields, one identifying the term and the other identifying the class in the term.
The Registrations file is also a fact table containing one record per student per class. The Section ID in it likewise is a concatenation of the term and class number.
The Special Fees file in my mind is also a fact table in that it can contain multiple records per class Section, yet will not contain a record for every class. Once again, the Section ID is a concatenation of the term and class number. Not only are there two different types of charges - flat or per hour (Bill) - those charges can also be divided between two or more FOAPs. The FOAP is a concatenation of the Fund Code, Organization Code, Account Code, and Program code. This FOAP is not contained in the table as originally retrieved via ODBC, but comes from a separate lookup table linked via a detail code not shown. This table also contains both tuition and fee charges.
The FOAP is the means of relating the Special Fees data to the Ledger table, which likewise has the key comprised of the concatenation of four fields. Not only will I need to compute tuition and fee charges for each Registration, but I will also need to compute them for each FOAP in the Ledger. So, in essence I’m working with four separate fact tables for this computation. And this is simply one very small portion of the overall report. When completed, the report will allow the user to select from a list of 30+ programs and see all enrollment, demographic, and financial data for the program as a whole or split out down to each individual student. Of course, I’m sure this would be easier done if we had a data warehouse that had the data stored in an optimized fashion for reporting.
I have a built a method of getting the amounts using a series of queries merged in Power Query, but I know there’s a simpler way of handling it in the report itself using DAX. I will be retiring next spring and want to leave my coworkers with a simpler report they can manage in the future as there are inevitably changes in coding every year. Again, I hope to be able to produce a sample file the first of next week that I can upload.
You could then apply subsequent filters to the base measure to get the exact figures you’re after.
I’d also take out the Ledger table. But I wasn’t sure what you were using it for? (I’m assuming in this case it is just the current balance, so isn’t useful in these calculations.)
I don’t have much information about your data but have you tried grouping up your data a little bit more in Power Query before uploading the data into Power BI?
I used to have a Data Model with a couple of “Bridges” that at the end were not the best option because once my model start to grow, it was hard to keep track of my core values and I had a lot of circular dependencies errors.
I’ve attached a sample file with data for one term. What I’m wanting to accomplish right now is:
If a matching record in Special Fees is found and the [Fee Type] = “BILL” then multiply the [FOAP Amount] * [Bill Hr].
If the [Fee Type] = “FLAT” then just show the [FOAP Amount] for each record in Registrations.
Some SectionIDs will have both a BILL and a FLAT Fee Type. Some will have neither. I believe if I can get help with the above I will be able to use variations of it for other needs.
Just for information purposes - not related to the above request - as far as the Ledger table is concerned, while it doesn’t come into consideration on the measures relating to class section special fees, ultimately I need to use the totals from the measures to modify the Amount in the Ledger. The Ledger contains totals related to revenue and expenses. This report will ultimately relate all such totals down to even each enrollment. Tuition and fee amounts will relate to numerous FOAPS in the Ledger, as will other class section related revenue sources. So will the salary and benefits of the instructors. There are some FOAPs in the Ledger that relate to the class subject, such as Math or English, but aren’t directly related to specific classes - like department secretaries, supplies, etc. Any subject level FOAP in the Ledger with an amount not directly attributed to a class section will be divided between all class sections (in the subject) based on total credit hours. That will be shown as a direct subject expense.
Other amounts not directly related to a class or a subject, such as staff salaries and benefits, utilities, etc. are further distributed to each class on a per credit hour basis and is shown as indirect expenses. The bottom line will reflect each class (or even student’s) bearing on the profit or loss of the entire institution.
I just noticed, the sample data related the Section and Registration files on CRN rather than Section ID. While that will work since I limited it to only one term, my actual report links those tables on Section ID.
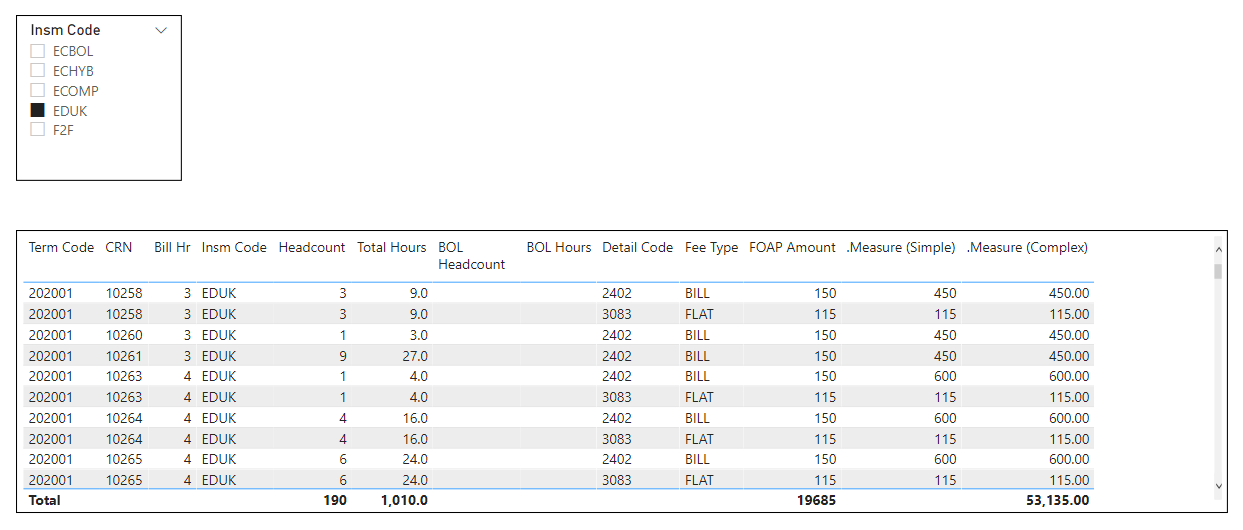
I’ve reworked the BOL measures and provided a couple of new measures to do what you you’re wanting to achieve. A simple version and a complex version.
The complex version will give you the correct grand total (as a summation of each row in the table), as long as you keep the granularity of the cross join and subsequent summarize consistant with the table it is being used in. i.e. keep the same number of rows.
This should give you a good idea on what you need to do moving forward.
I, too, worked out a way to accomplish it today. I first added a calculated table named Section Counts and then used it to create the measures I needed. My values are different from yours in that I also did a variation that fits the columns I will actually use rather than just the info I had shared in my request. I’ve uploaded the modified sample I produced today.
I will look more closely at your additions and will more than likely use a modification of both your work and mine. I can learn more as I study your method and I’m sure your help will be reflected in several aspects of my final report once finished. Thanks again for your help!