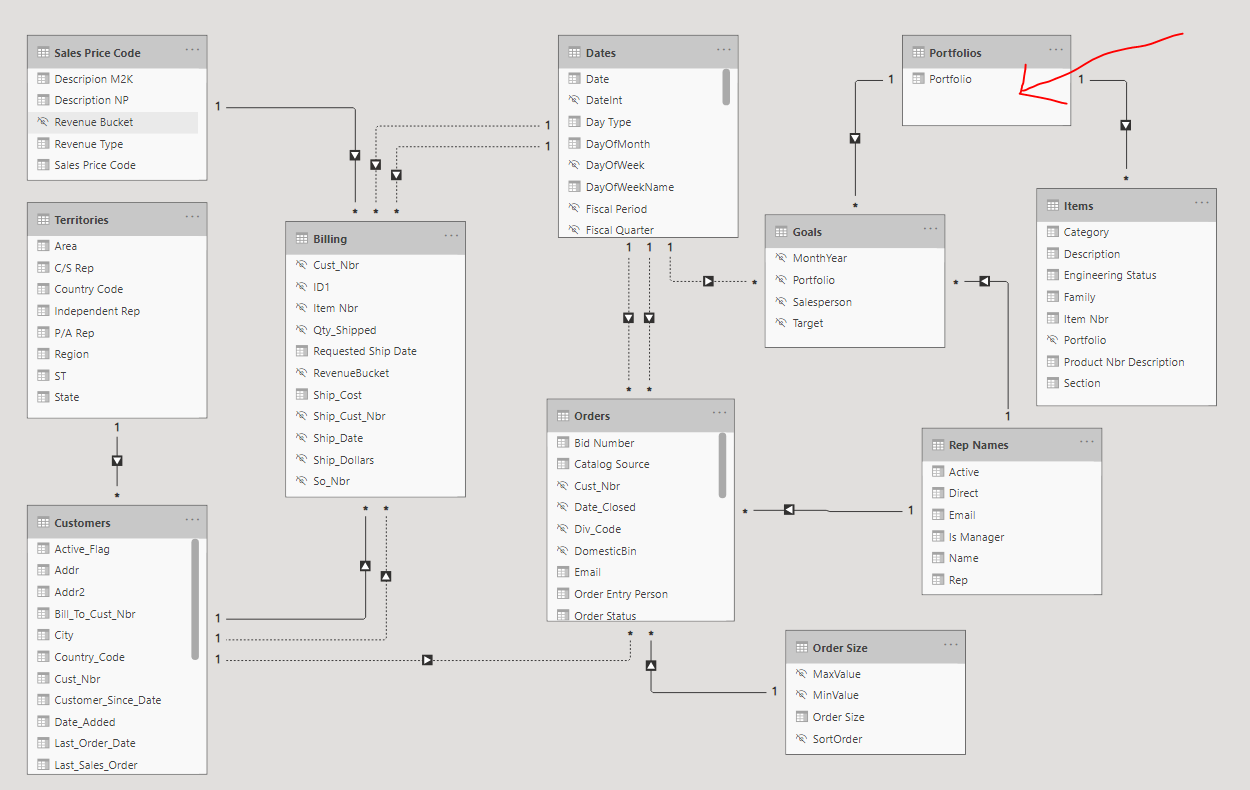
The latest piece I introduced was the Goals table. It’s not possible to create a relationship between Goals and Items because it would be Many-to-Many. An intermediary table called Portfolios was created to enable a One-to-Many relationship to Goals and Items. When trying to show sales versus goal, I used the following DAX calculations.
Total Goals =
CALCULATE (SUMX (Goals, Goals[Target]),
USERELATIONSHIP(‘Dates’[Date], Goals[MonthYear]))
Goal Year to Date =
CALCULATE ([Total Goals], DATESYTD ( Dates[Date] ))
When I select Rep from the Rep Names table and Goal Year to Date, it displays data through September. However, when I replace Rep with Portfolio from the Portfolios table, it shows the entire 2020 goal, not the YTD goal.
Total Sales =
CALCULATE (SUMX ( Billing, Billing[Ship_Dollars]),
USERELATIONSHIP(‘Dates’[Date], Billing[Ship_Date]))
Sales Year to Date =
CALCULATE ([Total Sales], DATESYTD( Dates[Date] ) )
How do I get the YTD formula to work when selecting the Portfolio from the intermediary table?
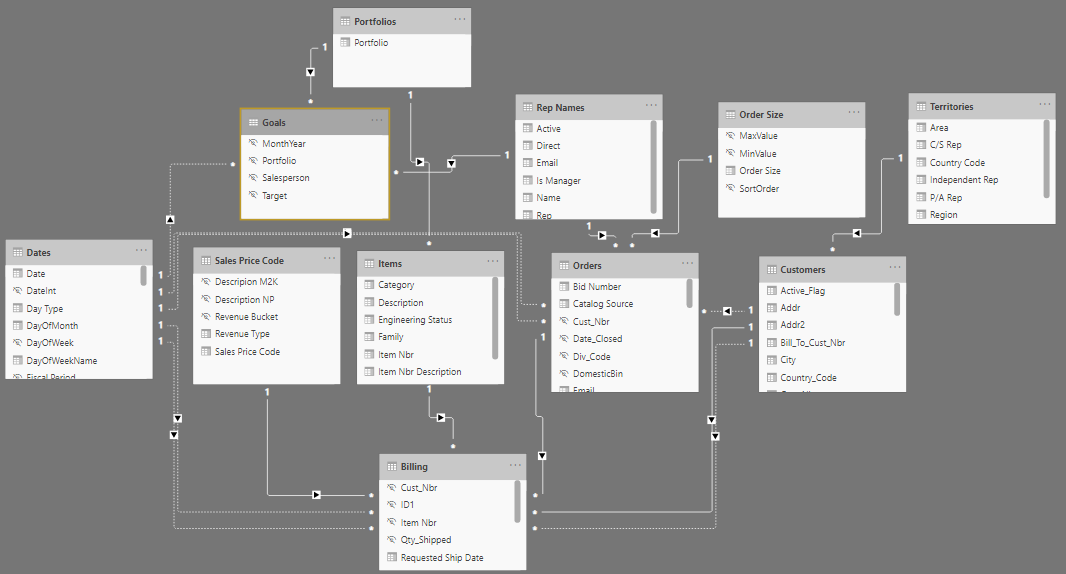
I am not able to diagnose these types of problems without a PBIX file to play around with for a multi-level data model like this, but I do have some immediate recommendations for simplifying your data model substantially, which may make solving this easier.
This seems like a perfect scenario for creating virtual relationships to the Goals table using TREATAS. This would allow you to treat the Goals table as a disconnected supporting table and get rid of the intermediate Portfolio table, substantially simplifying your data model and calculations.
In the TREATAS entry in the eDNA Knowledge base, there is a video entitled “Allocating Monthly Budgets”, which I think is highly analogous to your scenario - budget goal at a different granularity, creating a many-to-many problem, solved by TREATAS.
I hope this is helpful.
Brian
P.S. If you want to stick with your current data model, you will probably need to post a PBIX file to get a specific answer on the forum.
I stripped out confidential information and most of the history to create a copy of the model. Please note that I’m in the early stages of developing the model and am open to any input. Thank you! M2K DNA.pbix (2.0 MB)
@AntrikshSharma thanks for the remodel. It’s interesting and enlightening to see a different approach to the model. Is there a reason why the relationship between the Items and Billing was removed? Is that what fixed the Goals issue? In the original model I hid ‘Billing’[Item Nbr] from the report view because I was using many of the dimensions from the Items table for reporting purposes. It seems that fixing the Goals issue is creating a different reporting issue.
Apparently when I was stripping out details from the file @AntrikshSharma, I must have inadvertently removed a couple of relationships. @BrianJ - you should use this file for review. The original relationships shown in yesterday’s post have been fixed in the attached file. M2K DNA.pbix (2.1 MB)
Worked on this for a while last night, but I’m going to need to do some Power Query transformations, so will need you to please also post the "M2K DNA Data.xlsx " file.
@npeterson You have mentioned it displays data through September, can you show an image displaying that? because DATESYTD doesn’t works till month that we all currently are in, it just take the last date visible in the filter context and shows all the data till that date, doesn’t matter if current month is September or December, so if you are seeing running total till December 2020 that’s not incorrect.
I figured out why I was getting different results when looking at the Rep YTD goal and the Portfolios YTD goal. I had a relative date page filter on the Rep YTD tab for the past 1 year. When I added this to the Portfolios tab, I got the results I was expecting.
Thanks @BrianJ and @AntrikshSharma for taking time to look at the model. If there are any other insights that you found while looking at this, I’d appreciate the feedback.
Thanks to the contributors of this post. Due to the length by which this post has been active, we are tagging it as Solved. For further questions related to this post, please make a new thread.
