Evening All,
I’ve been struggling with this issue for a couple hours now. It’s probably a simple DAX formula but I can’t function right now. I apologize for not having an example but my battery died and relying on my phone right now.
The Question:
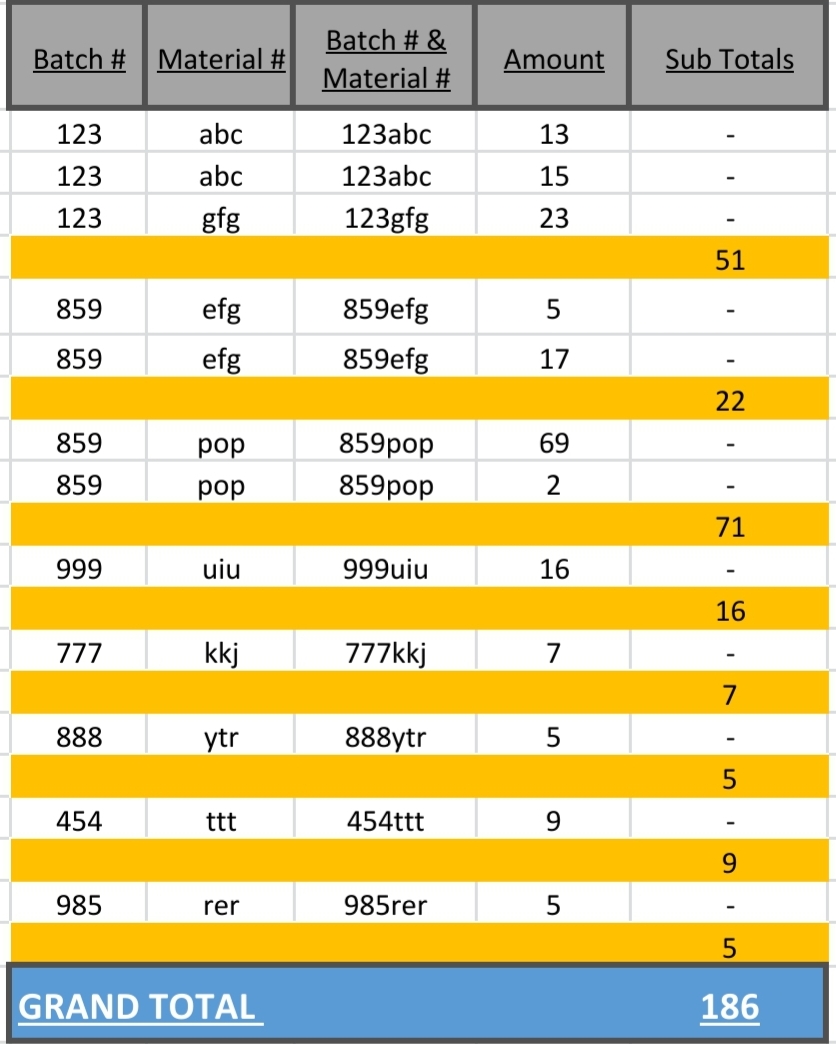
How to sum a column based on the common values of another column, much like a pivot table does in Excel with a Grand Total at the bottom. It’s more of a subtotal and then a Grand Total.
The aggregation needs to happen when there are common values in the Batch # & Material # column. This needs to be very dynamic to account for lots combinations of Batch & Material #s.
Welcome to the forum! It’s a wonderful community, and we’re glad to have you here.
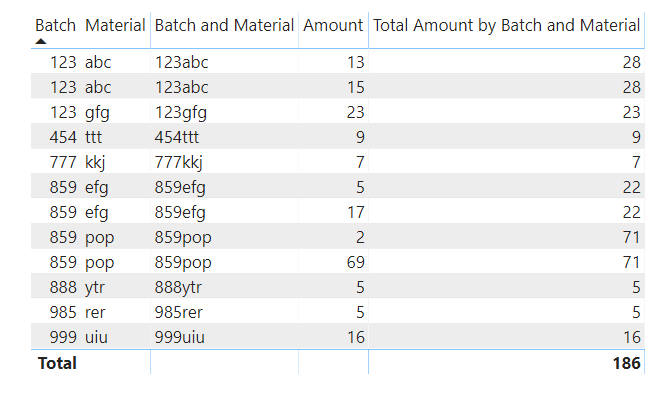
The measure to produce your total amount by batch and material is a pretty straightforward application of ALLEXCEPT:
Total Amount by Batch and Material =

CALCULATE(
    [Total Amount],
    ALLEXCEPT(
        Production,
        Production[Batch and Material]
    )
)
However, I wasn’t sure from your question whether you were trying to replicate the format of the table exactly, or just using that for illustration to explain the calculation you wanted to be able to do. Even with a matrix visual, rather than the table visual above, that exact format is difficult to achieve.
Please let me know if the DAX above is sufficient, or if we want to work further on trying to replicate the exact format.
Thanks. I hope this is helpful. Solution file attached below.
Thanks BrianJ. This helps but fortunately, I need to achieve the tabual view to show transactions going in and out of inventory in a summary view. I know that this isn’t optimal but it’s what my departmental customer wants which is why I compared it originally to a pivot table in Excel. It is rare to get a request like this but it happens every blue moon.
In Excel, this would be a 1 minute thing but it really needs to be in Power BI, to go along with the rest of the reporting package.
In that case I think you will have to use a matrix view, and then we will have to get quite creative with conditional formatting, hiding values by matching font color with background color, etc.
If you can please post your PBIX with your maximum progress in achieving the desired format/structure, we will try to bring it across the finish line.
One question – would we be allowed to use custom visuals to achieve the desired result?
@BrianJ
I will post a simple slice of the PBIX file as I get to the office. The screenshot is the desired view, minus the ugly colors .
I’m not quite sure what you mean by custom visuals. At this point, I would like to keep it simple to the requirement. I can always modify the colors later.
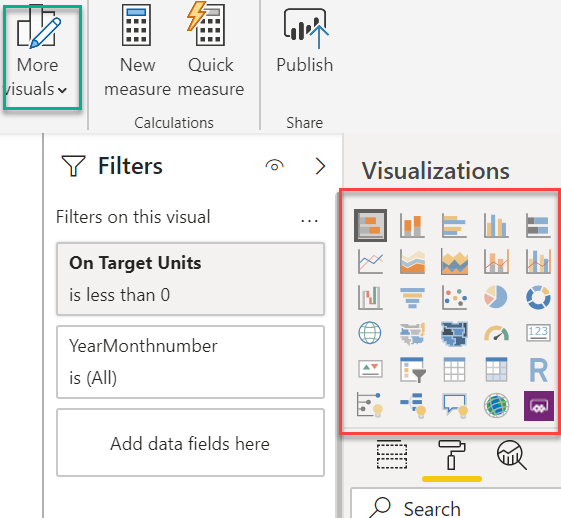
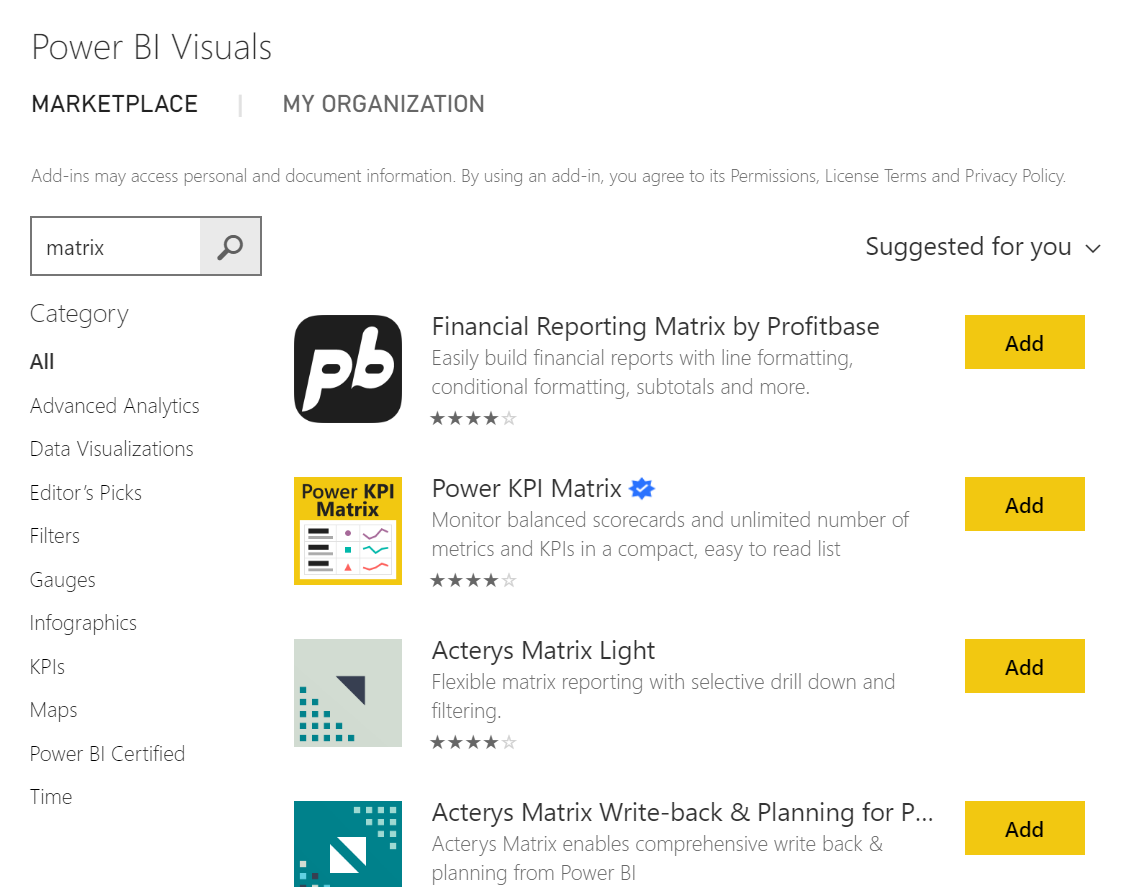
However, by clicking on “More Visuals” (green box), it opens up something called the Marketplace where you can download a huge number of custom visuals that you can plug into Power BI.
If your organization allows the use of custom visuals, that will give us a lot more flexibility and options in achieving your desired format, since the standard matrix visual is pretty restrictive:
Attached is the PBIX sample file. I tried using you formula but it didn’t seem to display correctly.
Keep in mind that the goal is not to have to filter on a particular Batch/Material but rather on selected relative dates, to see what the ending QTY/Balance, resulting from “Code Descriptions” which are "In’s and Out’s. I hope this makes sense. Below is the Excel Pivot Table view. I am also attaching the PBIX file as well
I am not sure if you’re open to a template-based design for the report? Enterprise DNA has a great video in the Financial Reporting w/Power BI section called Embedding financial template design into report page.
I’ve used the concept to create a custom profit and loss report that included subtotals and grand totals wherever needed. The PBI matrix visual is sometimes insufficient, so a custom design is sometimes the next best alternative.
Mark,
Using a template-based design was originally at the top of of my list to use. I plan to use this design in the near future, for my Financial reporting which is very structured.
However, in this situation, it’s not going to be optimal because each Batch/Material combination would have approx. 10 rows of which most could be without values. This would be similar to an Excel pivot table when you allow for rows without values to show. I am going for the opposite, a pivot table view without showing Batch/Material rows with no values.
This view will need to be very dynamic since know what future batch, material, and batch/material values will be unknown. Keep in mind that the user wants to only filter on relevant date selected to see the balance within a period.
Now that I think about this, I could use this for a summary view but I’m not sure it would be dynamic enough for a detailed view.

 .
.
 i wasn’t quite awake yet.