Hello @ashraf,
Thank You for posting your query onto the Forum.
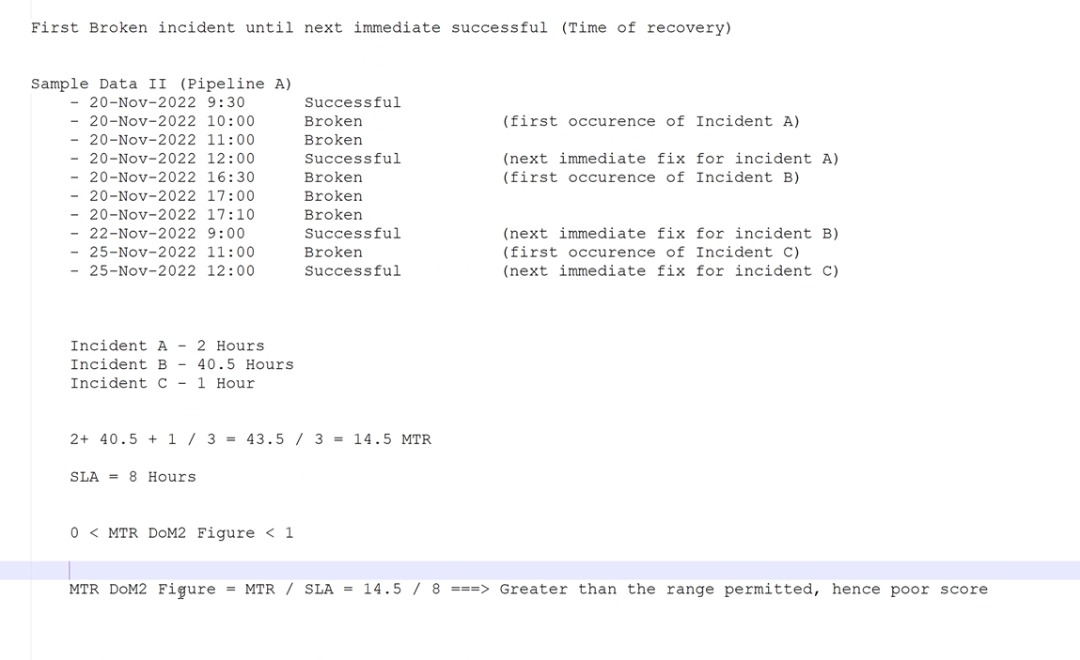
In order to achieve the results based on the data and scenario that you’ve provided in the form of screenshot. You’ll first be required to transform and model the data before writing the DAX measures.
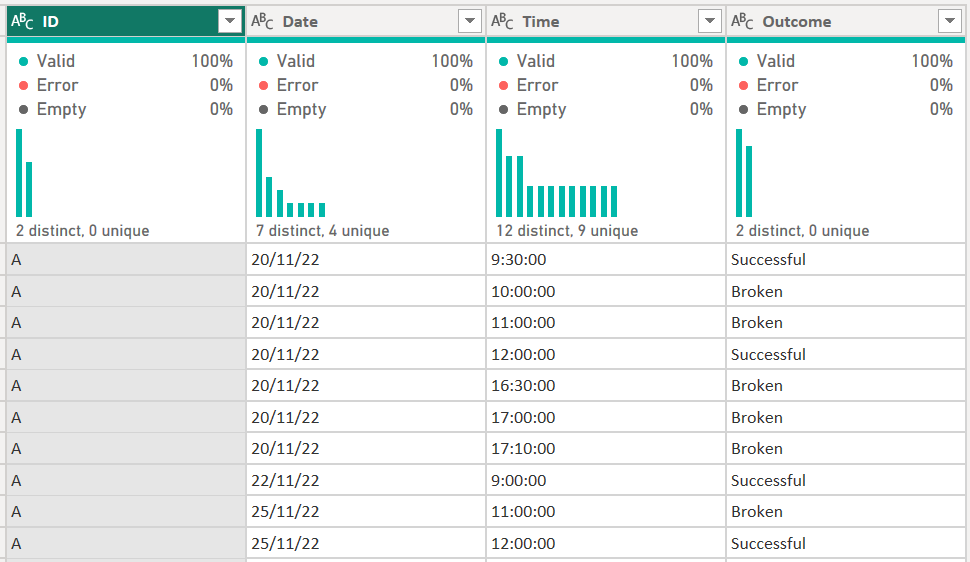
Paste the below provided M code in your Advanced Editor so that data is modelled from this -
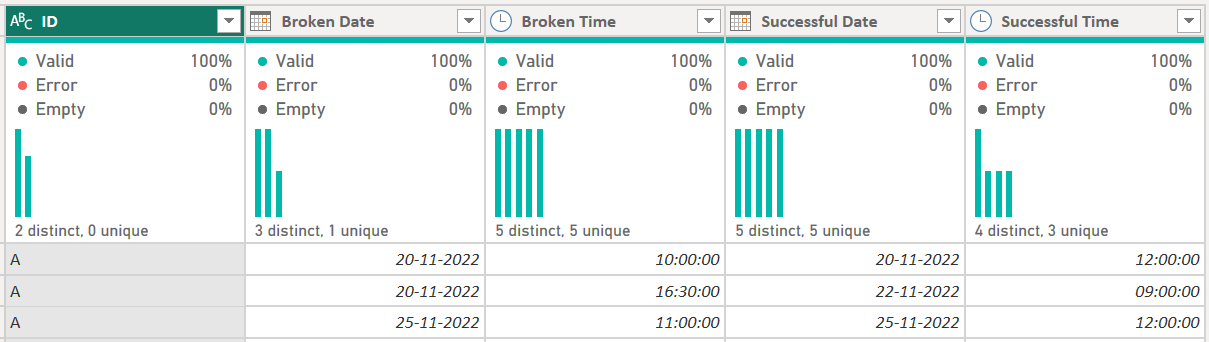
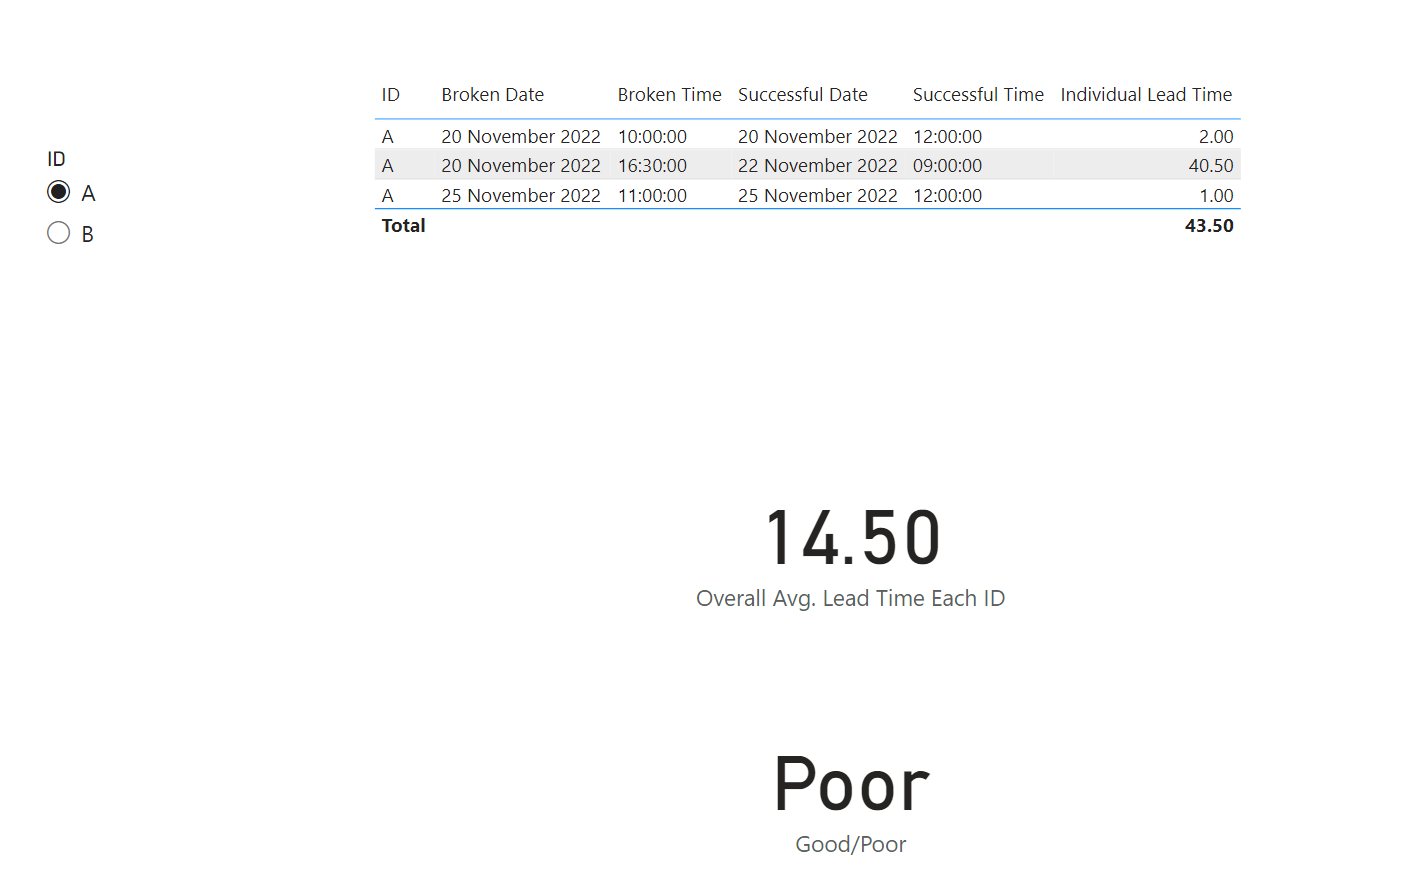
To this -
let
    Source = Table.FromRows(Json.Document(Binary.Decompress(Binary.FromText("jdDBDkAwDAbgd9lZsrUzYzdewVGchAshId7fFrEQM7318KX/3zYNK1nCUHAAjmjHwkhhhLBTvXddv23DPrE2eTlw6oTVuoz9HERAQejRT2Tmu0W2aUqkNvCB8PaJWC1FOVIRjqwc5JZJx1SMyYvlocSHsL+iLMJgd0dSv+mTZJ7oYFh7AA==", BinaryEncoding.Base64), Compression.Deflate)), let _t = ((type nullable text) meta [Serialized.Text = true]) in type table [ID = _t, Date = _t, Time = _t, Outcome = _t]),
    #"Changed Type" = Table.TransformColumnTypes(Source,{{"ID", type text}, {"Date", type date}, {"Time", type time}, {"Outcome", type text}}),
    #"Sorted Rows" = Table.Sort(#"Changed Type",{{"ID", Order.Ascending}, {"Date", Order.Ascending}, {"Time", Order.Ascending}}),
    #"Added Custom" = Table.AddColumn(#"Sorted Rows", "Status", each if [Outcome] = "Successful" then 0 else 1, Int64.Type),
    #"Grouped Rows" = Table.Group(#"Added Custom", {"ID"}, {{"FullTable", each Table.AddIndexColumn(_, "Index", 0, 1), type table}}),
    #"Added Custom1" = Table.AddColumn(#"Grouped Rows", "Previous Status", each
    let
        AllDataTable = [FullTable],
        PrevRowValue =
            Table.AddColumn(
                AllDataTable, "PrevStatusValue",
                each try AllDataTable [Status] {[Index]-1}
                otherwise 0 )
    in
        PrevRowValue),
    #"Previous Status" = Table.Combine(#"Added Custom1"[Previous Status], {"ID", "Date", "Time", "Outcome", "Status", "PrevStatusValue"}),
    #"Changed Type1" = Table.TransformColumnTypes(#"Previous Status",{{"ID", type text}, {"Date", type date}, {"Time", type time}, {"Outcome", type text}, {"Status", Int64.Type}, {"PrevStatusValue", Int64.Type}}),
    #"Overall Status" = Table.AddColumn(#"Changed Type1", "OverallStatus", each [Status] + [PrevStatusValue], Int64.Type),
    #"Filtered Rows" = Table.SelectRows(#"Overall Status", each ([OverallStatus] = 1)),
    #"Added Broken Date" = Table.AddColumn(#"Filtered Rows", "Broken Date", each if [Outcome] = "Broken" then [Date] else null, type date),
    #"Added Broken Time" = Table.AddColumn(#"Added Broken Date", "Broken Time", each if [Outcome] = "Broken" then [Time] else null, type time),
    #"Filled Down" = Table.FillDown(#"Added Broken Time",{"Broken Date", "Broken Time"}),
    #"Filtered Rows1" = Table.SelectRows(#"Filled Down", each ([Outcome] = "Successful")),
    #"Removed Other Columns" = Table.SelectColumns(#"Filtered Rows1",{"ID", "Broken Date", "Broken Time", "Date", "Time"}),
    #"Renamed Columns" = Table.RenameColumns(#"Removed Other Columns",{{"Date", "Successful Date"}, {"Time", "Successful Time"}})
in
    #"Renamed Columns"
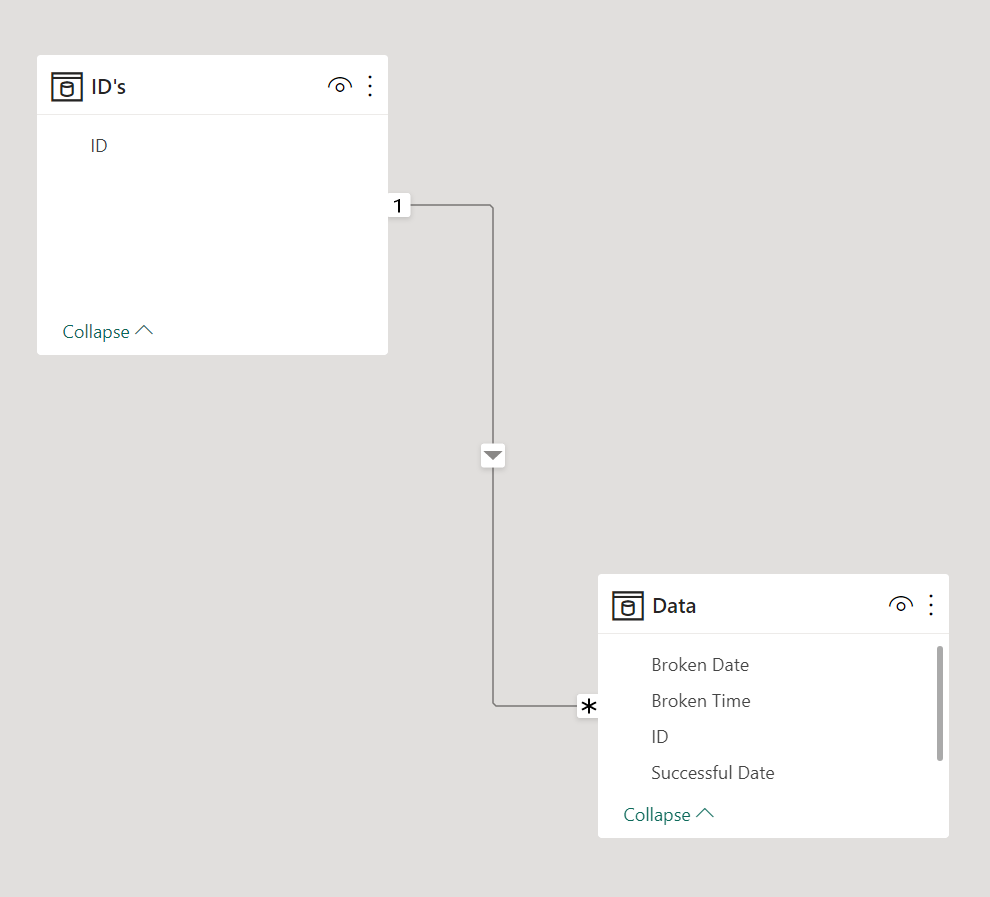
Here’s how your data model will look like -
Once data is transformed and modelled then you can write the below provided measures to achieve the results -
Individual Lead Time =
SUMX(
    ADDCOLUMNS(
        SUMMARIZE(
            Data ,
            Data[ID] ,
            Data[Broken Date] ,
            Data[Broken Time] ,
            Data[Successful Date] ,
            Data[Successful Time] ) ,
        "@Total_Lead_Time" ,
        DIVIDE(
            DATEDIFF(
                Data[Broken Date] + Data[Broken Time] ,
                Data[Successful Date] + Data[Successful Time] ,
                MINUTE ) ,
            60 ) ) ,
    [@Total_Lead_Time] )
Overall Avg. Lead Time Each ID =
VAR _Total_Lead_Time_Per_ID =
CALCULATE(
    SUMX(
        ADDCOLUMNS(
            SUMMARIZE(
                Data ,
                Data[ID] ,
                Data[Broken Date] ,
                Data[Broken Time] ,
                Data[Successful Date] ,
                Data[Successful Time] ) ,
            "@Total_Lead_Time" ,
            DIVIDE(
                DATEDIFF(
                    Data[Broken Date] + Data[Broken Time] ,
                    Data[Successful Date] + Data[Successful Time] ,
                    MINUTE ) ,
                60 ) ) ,
        [@Total_Lead_Time] ) ,
    ALL( Data ) ,
    VALUES( Data[ID] ) )

VAR _Total_Rows_Per_ID =
CALCULATE( COUNTROWS( Data ) ,
    ALL( Data ) ,
    VALUES( Data[ID] ) )

VAR _Results =
DIVIDE(
    _Total_Lead_Time_Per_ID ,
    _Total_Rows_Per_ID )

RETURN
_Results
Good/Poor =
VAR _Overall_Lead_Time_Each_ID =
[Overall Avg. Lead Time Each ID]

VAR _SLA =
8

VAR _MTR_DoM2_Figure =
DIVIDE(
    _Overall_Lead_Time_Each_ID ,
    _SLA )

VAR _Good_or_Poor =
IF(
    _MTR_DoM2_Figure > 0 && _MTR_DoM2_Figure < 1 ,
    "Good" ,
    "Poor" )

RETURN
_Good_or_Poor
I’m also attaching the working of the PBIX file for the reference purposes. Please go through the steps that are applied in the Power Query for your understanding. And in case, you want to learn more about Advanced Power Query and DAX then please go through the courses which are available on EDNA education portal.
Hoping you find this useful and meets your requirements that you’ve been looking for.
Thanks and Warm Regards,
Harsh
Calculation on Lead Time of Failure Incident - Harsh.pbix (27.2 KB)