Hello Everyone,
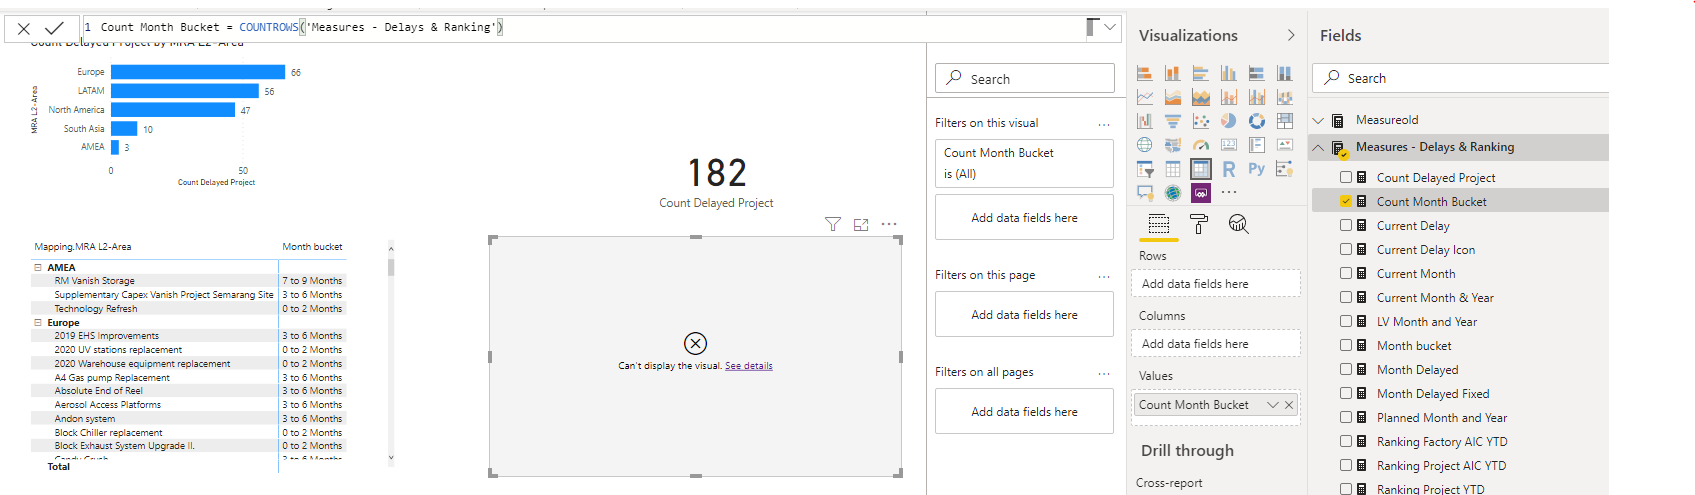
I am trying to count the number of project falling under a certain bucket. The bucket is text from a Dax formula. I am trying different Counta/Countrows etc but i am not able to see the outcome I expect.
Here a screenshot of my table:
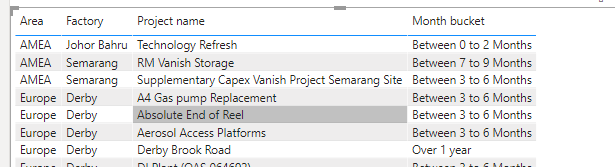
So I am trying to count how many projects are falling under each Area & belong to the month bucket “Between 0 to 2 Months” or “Between 3 to 6” or “between 7 to 9” or “Over 1 year”…
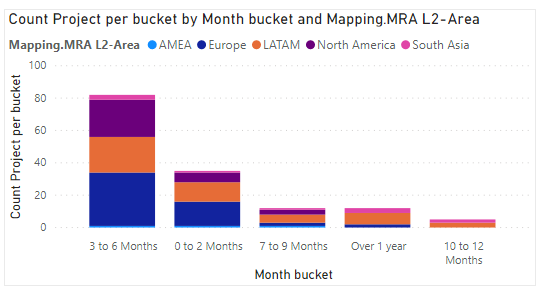
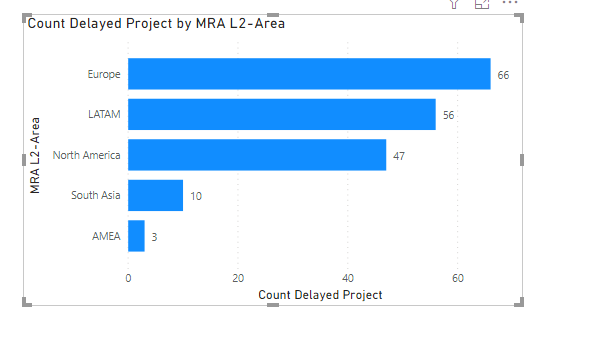
The graph I am trying to achieve is something like the below but I instead of the Area I will have the different “monthly bucket” and then the number of project falling under each of them.
I tried this => Count Month Bucket = COUNTROWS( FILTER(‘Measures - Delays & Ranking’,[Month bucket] = “Between 0 to 2 Months” ))
where the Month bucket is calculated as this:
Month bucket = SWITCH(TRUE(),
[Month Delayed] >12, “Over 1 year”,
[Month Delayed] >=10 , “Between 10 to 12 Months”,
[Month Delayed] >=7 , “Between 7 to 9 Months”,
[Month Delayed] >=3 , “Between 3 to 6 Months”,
[Month Delayed] >0 , “Between 0 to 2 Months”, BLANK())
Thanks a lot for the help.
Take Care & Stay safe,
KR
Julie
@Julieee299,
You can use a very simple COUNTROWS() measure here:
Count Projects = COUNTROWS( ‘Table’ )
and then just let the evaluation context of the table do the work (because the non-delayed projects return a blank from the SWITCH statement, they are easy to filter out of the table/visual)::
I recommend removing “Between” from your SWITCH statement results, so that you can sort the results of your bar chart properly.
I hope this is helpful. Full solution file attached.
1 Like
Hello Brian,
Thanks for your support - I did your suggestion for the “Between” but from your solution you have the month bucket as a column in a table (but in my model its a calculation) and your solution doesn’t work unfortunately.
See below:
Many thanks again,
Kind regards,
Julie
Hi @Julieee299,
You need to bring in the Month Bucket context to the Rows section of your Matrix visual. To sort that create a Calculated Column referencing the [Month Bucket] measure in your Projects table and bring in that column. As soon as the context is provided the Count rows will work.
I hope this is helpful.
2 Likes
Hello Melissa,
Thanks a lot for this tips  Its working now.
Many many thanks again,
Have a very nice day
Take care & Stay safe
Julie
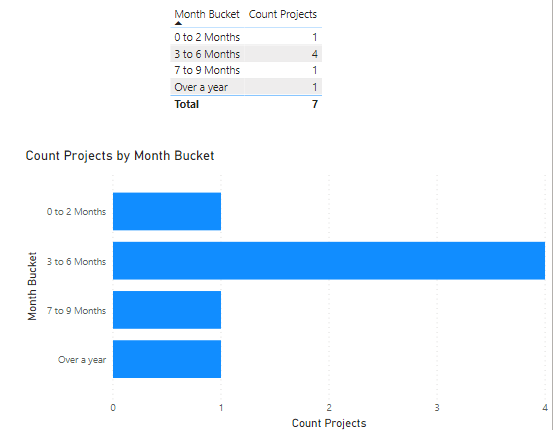
Below my beautiful graph haha