Im struggling to figure out how to solve this problem.
I have a table that shows the amount of Work-years (WY) employees are working on various projects, and the start and end date for the various projects (see table below)
Table1
Employee
ProjectID
WY
Start_date
End_date
A
1
0,5
01.01.2024
31.08.2024
A
2
0,5
01.01.2024
31.08.2024
A
1
1
01.09.2024
31.12.2024
B
1
1
01.01.2024
31.01.2024
B
2
1
01.02.2024
31.03.2024
B
3
1
01.04.2024
31.12.2024
C
4
0,5
01.01.2024
31.12.2024
I am trying to make a matrix that shows the amount of WY for the various projects per month like this:
Prjojects
jan.24
feb.24
mar.24
apr.24
may.24
1
1,5
0,5
0,5
0,5
0,5
2
0,5
1,5
1,5
0,5
0,5
3
0
0
0
1
1
4
0,5
0,5
0,5
0,5
0,5
I have created a date-table and have created a relationship between the two tables but I cant figure out which function to use in my dax calclation to get i to work. My guess is that I need to use a create a formula that checks whether or not the context is between the start and end-date in table 1, but I cant figure out how to go about it.
can you attach the pbix ?
what is the relatinship between your datetable and table1?
if it is on the start date then you will have only months 1 2 4 9
your table1 is a dimension table what I’m missing is the fact table with the data like
employee, project ID , month or date , and WY
and then the relationship will work correctly
Sorry for the late reply. I have been away on holiday.
Thank you the response.
In response to your first post:
There is a one-to-many relationship between the datetable and start date.
I thought table 1 was considered a fact table as this is where all the WY is stored. I have separate dimension tables for projects and employees.
In the pbix you attached I see that you created one row per month for each employee for each project. Maybe I should have stated that inn my orginal post, but what I posted was a sample of my datasett. In my actual dataset I have 500 employees and 200 projects and goes from 2018 up until 2024 (and will continue),. Thus I think this approach, will make the datamodel very large and perhaps slow?
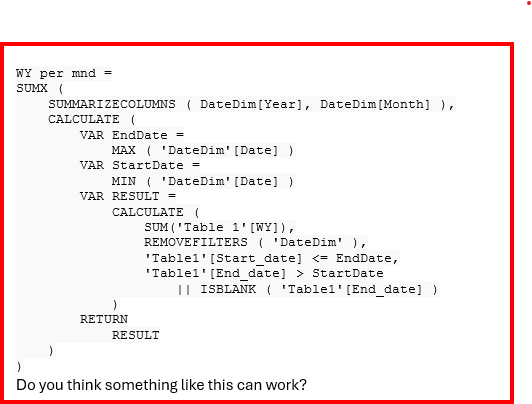
I have tried something like this, but not sure If I get the correct results:
WY per mnd =
SUMX (
    SUMMARIZECOLUMNS ( DateDim[Year], DateDim[Month] ),
    CALCULATE (
        VAR EndDate =
            MAX ( 'DateDim'[Date] )
        VAR StartDate =
            MIN ( 'DateDim'[Date] )
        VAR RESULT =
            CALCULATE (
                SUM('Table 1'[WY]),
                REMOVEFILTERS ( 'DateDim' ),
                'Table1'[Start_date] <= EndDate,
                'Table1'[End_date] > StartDate
                    || ISBLANK ( 'Table1'[End_date] )
            )
        RETURN
            RESULT
    )
)
Magnus,
I tested you measure and it gives a result but not the table you want.
It is the relation between the datetable and the start date of your Table1 that results in only 4 months ( the months in your start column).
I look further, maybe the user relationship() can help.
Or unpivot your factable so you have only on date column.
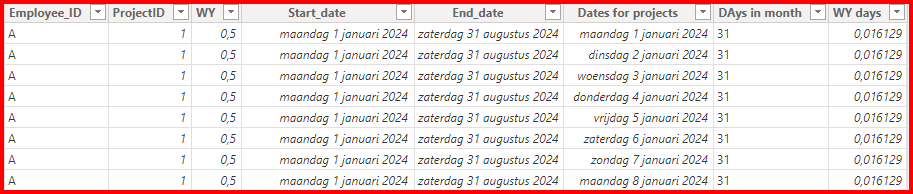
started with reference the dimension table called it " Dimensiontable expanded "
added some additional column using M language (–> check via Edit query to see the M code)
column Dates for projects expands the table for each project with dates between startDate and endDate
a correction column for the WY value on a daily basis
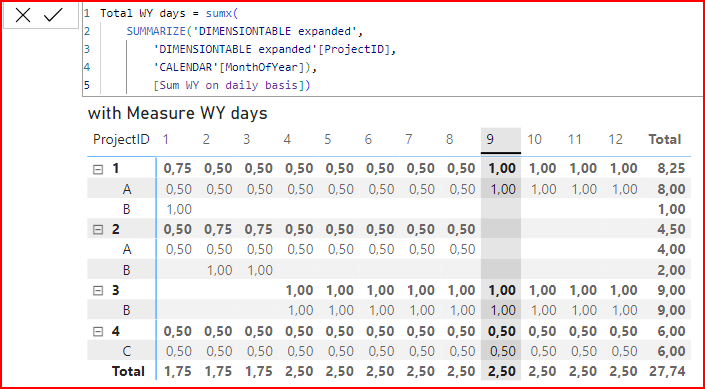
a relationship between the datetable and the " Dimensiontable expanded "
below a screenshot of the " Dimensiontable expanded "
you can delete the start Date and End Date via Edit Query, I left them for checking purpose
the row totals on the second visual are not correct and therefore hidden.
the totals on the first visual are correct but miss a day on the last day of the project ( see december and august )