Hi @judy_fmf,
Welcome to the Forum!
And big thanks for your detailed explanation and supplying a sample PBIX ![]()
I’ve changed the Date table M code you used to the Extended Date table you can find here
Great job on setting up a disconnected date table, that’s exactly what you need in a scenario like this. Just one remark you had placed the Year from fact table Sales on the axis of your bar chart so I changed that to Year from the Dates table. To avoid wrong selections like these, I always recommend to ‘hide in report view’ all fields from fact tables that are keys to- or attributes of dimensions.
Next I created this measure:
Sales by Year and Month =
VAR ThisYear = SELECTEDVALUE( 'Dates Disconnected'[YearOffset] )
VAR YearRange = GENERATESERIES( ThisYear -2, ThisYear, 1 )
VAR ThisMonth = SELECTEDVALUE( 'Dates Disconnected'[MonthOfYear] )
RETURN

IF( SELECTEDVALUE( Dates[YearOffset] ) IN YearRange,
        CALCULATE( [Total Sales],
            FILTER( ALLSELECTED( Dates),
                Dates[Year] = SELECTEDVALUE( Dates[Year] ) &&
                Dates[MonthOfYear] = ThisMonth )
        ),
        CALCULATE( [Total Sales],
            FILTER( SUMMARIZE( Dates, Dates[YearOffset], Dates[MonthOfYear]),
                [YearOffset] IN YearRange &&
                [MonthOfYear] = ThisMonth ))
    )
.
With this result.
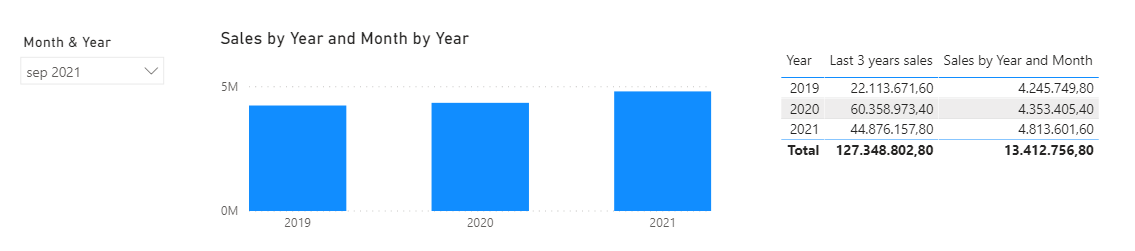
.
I hope this is helpful. Here’s my sample PBIX.
eDNA - Last 3 yrs sales for selected month.pbix (547.1 KB)