Hi all,
This is my first time on the forum 
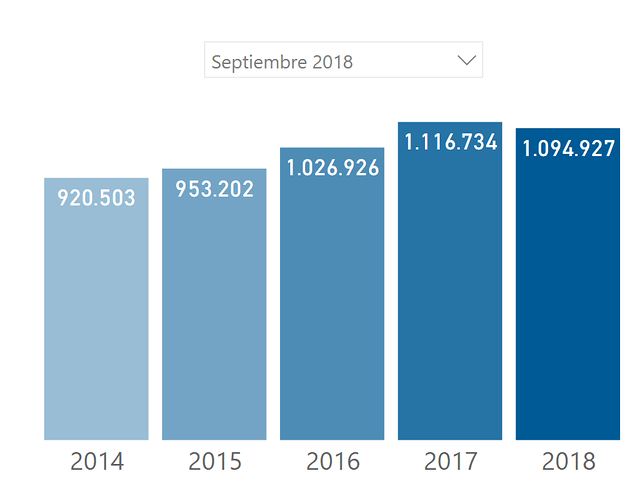
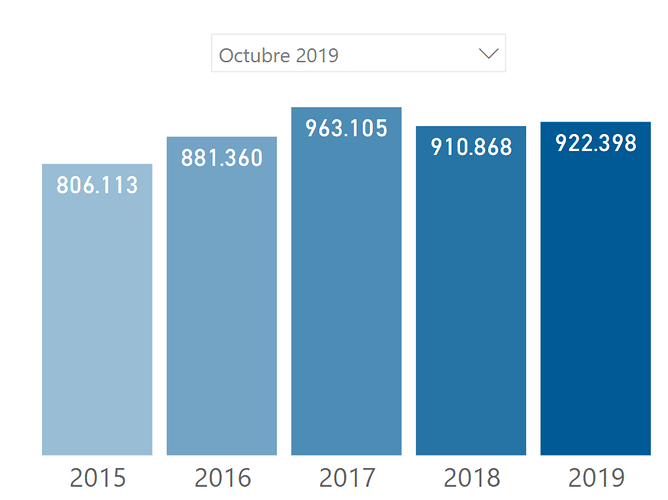
I am struggling with this scenario. I am trying to figure out a measure which will enable to visualize Sales from a specific period of time (Eg: month and year ‘Oct 2019’) of that same period of my last 5 years (‘Oct 2018’, (‘Oct 2017’ …) in a graphic chart ( one column value for each year). These values shoud dynamically change when choosing different period (month and year). I mean, if I change the value on the slicer to Sept 2018, graphic will return values for Sept 2017, Sept 2016…. Sept 2014.
I have tried to create a disconnected date table and apply this measure but is is giving me wrong result. It returns all year sales instead of sales for the month selected on the slicer (see pbix attached)
Last 3 years sales =
VAR CurrentDate = MAX ( 'Dates Disconnected'[Date] )
VAR PrevDate = DATE ( YEAR ( CurrentDate ); MONTH ( CurrentDate ) -36; DAY ( CurrentDate ) )
VAR Result = CALCULATE (
   [Total Sales];
    FILTER (
        Sales;
        Sales[OrderDate] >= PrevDate
       && Sales[OrderDate] <= CurrentDate
    )
)
RETURN Result
Forum_EnterpiseDNA.pbix (547.1 KB)
Thanks in advanced 
Hi @judy_fmf,
Welcome to the Forum!
And big thanks for your detailed explanation and supplying a sample PBIX 
I’ve changed the Date table M code you used to the Extended Date table you can find here
Great job on setting up a disconnected date table, that’s exactly what you need in a scenario like this. Just one remark you had placed the Year from fact table Sales on the axis of your bar chart so I changed that to Year from the Dates table. To avoid wrong selections like these, I always recommend to ‘hide in report view’ all fields from fact tables that are keys to- or attributes of dimensions.
Next I created this measure:
Sales by Year and Month =
VAR ThisYear = SELECTEDVALUE( 'Dates Disconnected'[YearOffset] )
VAR YearRange = GENERATESERIES( ThisYear -2, ThisYear, 1 )
VAR ThisMonth = SELECTEDVALUE( 'Dates Disconnected'[MonthOfYear] )
RETURN

IF( SELECTEDVALUE( Dates[YearOffset] ) IN YearRange,
        CALCULATE( [Total Sales],
            FILTER( ALLSELECTED( Dates),
                Dates[Year] = SELECTEDVALUE( Dates[Year] ) &&
                Dates[MonthOfYear] = ThisMonth )
        ),
        CALCULATE( [Total Sales],
            FILTER( SUMMARIZE( Dates, Dates[YearOffset], Dates[MonthOfYear]),
                [YearOffset] IN YearRange &&
                [MonthOfYear] = ThisMonth ))
    )
.
With this result.
.
I hope this is helpful. Here’s my sample PBIX.
eDNA - Last 3 yrs sales for selected month.pbix (547.1 KB)
1 Like
Hi @judy_fmf
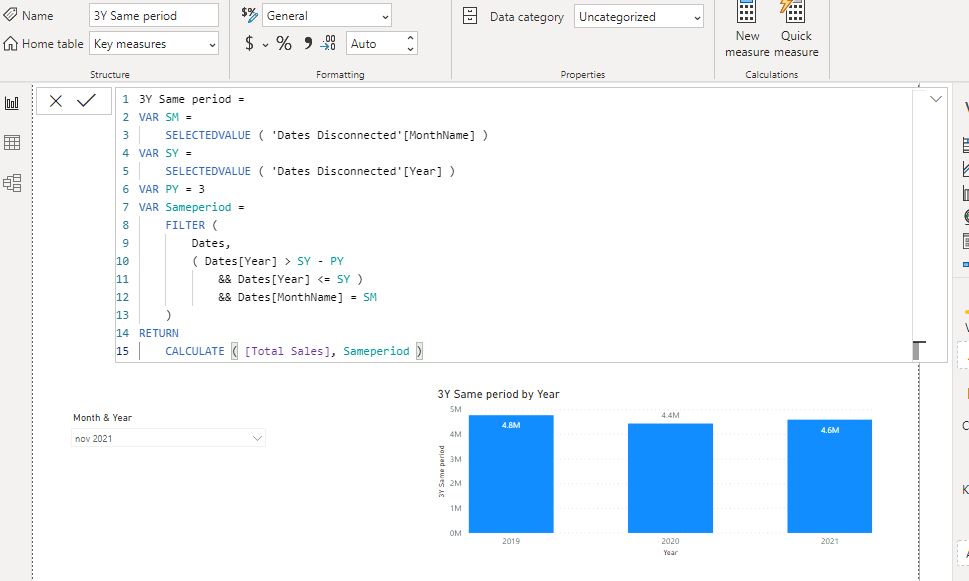
PFB solution for your requirement.
I’m just showing past 3years data. If you want you can change the Variable PY.
3Y Same period =
VAR SM =
SELECTEDVALUE ( ‘Dates Disconnected’[MonthName] )
VAR SY =
SELECTEDVALUE ( ‘Dates Disconnected’[Year] )
VAR PY = 3
VAR Sameperiod =
FILTER (
Dates,
( Dates[Year] > SY - PY
&& Dates[Year] <= SY )
&& Dates[MonthName] = SM
)
RETURN
CALCULATE ( [Total Sales], Sameperiod )
2 Likes
I was definitely overthinking it… time for a break 
Thanks for sharing @Rajesh
Thank both of you for your quick response.
I have already tried @Rajesh solution and works perfectly fine. It is such a simple and perfect solution…
I am now trying to understand Melissa’s. It’s a little bit more complicated for me but I want to try to understand it. By the way, @Melissa thanks for the extended date table script, it’s fantastic 
You’re welcome Judy.
Stick with @Rajesh solution it’s the best of the two.
1 Like


