I’m looking for some assistance with writing a DAX measure.
I have 2 Tables (Dates & Activity)
Current the Activity table has to 2 x Date fields (Work Recvd & Work Complted) with the dates table connected to Work Recvd.
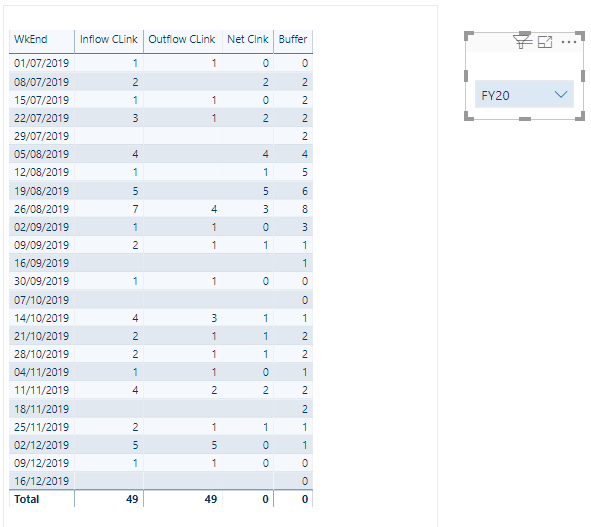
I am trying to establish what the Buffer level of activity is with following concepts:
Net Flow = Inflow- Outflow
Buffer =Net Flow + previous day’s buffer (+ or minus)
I’m not sure how i can write the DAX formula. when i use the date add function i get incorrect results. Any assistance or please point me in the direction of any previous posts/tutorials with similar concepts.
I have a screenshot to attach but for some unknown reason it will not upload the screenshot.
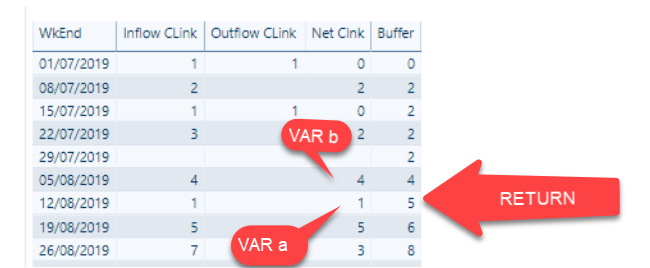
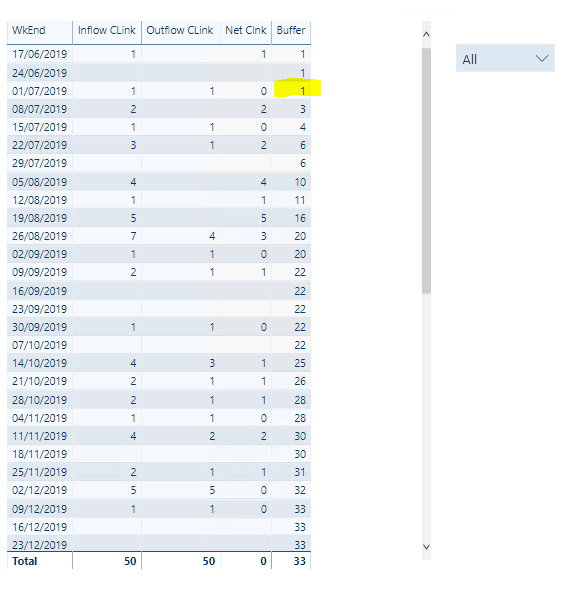
I’m probably missing something obvious here, but to me it looks like buffer is calculating exactly as expected given the content of the measure (see screenshot below - in each line, a+b = Returned value, i.e., value on a given date plus value 7 days earlier = return)
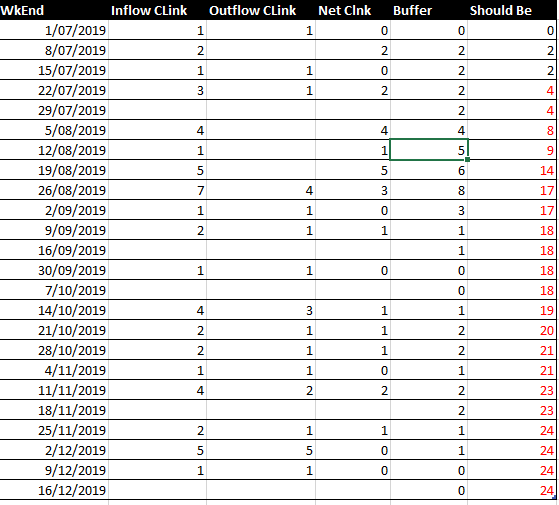
OK, so Buffer for any given date should just represent the cumulative total of [Net Clnk] to that date. Because you’re filtering by the fiscal year slicer, you’ll also want to incorporate ALLSELECTED into your cumulative total pattern. This short video will walk you through exactly how to craft that measure:
Hope this is helpful. Give a shout if you have any problems.
Very close. What’s missing is the aggregator that creates the total. If Net Clnk were a column, you would use SUM, but since it’s a measure you’ll need to restructure the cumulative total formula a little to use SUMX.
This should work for you, but if it doesn’t, please post your PBIX file so I can diagnose the issue. Also, make sure that Dates is marked as a date table, which is necessary to ensure that time intelligence functions, including cumulative totals, work correctly.
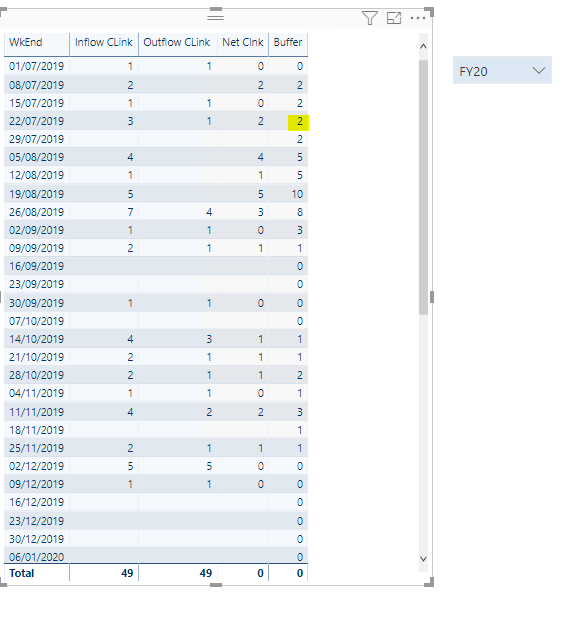
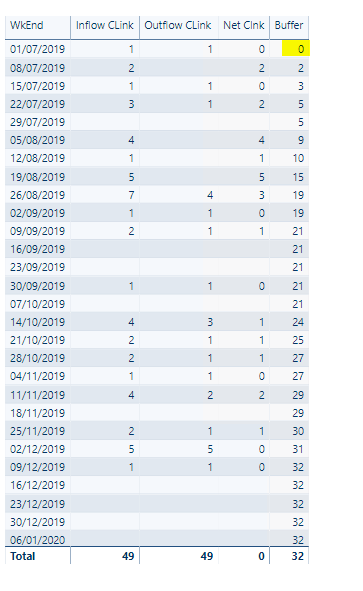
I do have one small issue though, when you look at all the dates (Unfiltered from the slicer) it shows up correctly. However when you add the date from the slicer (eg- FY 20) the carry from the previous FY year does not come through.
This is a very interesting issue. You would not expect DAX to have any “awareness” of prior fiscal years’ balance when a slicer is applied, so we will have to create that with custom code. If you could please post your PBIX file today, I can work up a solution tonight.
This turned out to be a really interesting problem. I’ve got a solution worked out, but have one final bug in the visual to squash. Need to call it a night, but will get you the full solution tomorrow.
Got 95% of the way there and then got absolutely stuck on the final step. I’m extremely stubborn, so I hammered away at it til far too late into the night, when I finally conceded and called for help. You can see the status of the current solution, both screenshot and PBIX at the link above. I’m confident that with the help of the forum, we’ll crack the final issue and complete the solution.
Hi @adsa, a new thread has been created to assist you in creating a solution to your issue. We are now tagging this topic solved, please visit the [link] to see the new solution provided by @BrianJ. Thanks! (Getting Measure to Display as Constant in Context)