Dateadd variable

Hi all,

I am looking to replace the interval part of a DATEADD function with SELECTEDVALUE so that users can choose the reference period for their Sales Diff measures.
Since direct replacement of interval with a Variable is not possible, are there any other ways to manage that?

Thank you / Thimios

Hi @Thimios

would you explain your work more specifically? I don’t get the point why you need to use SELECTEDVALUE as the first argument in the DATEADD function.
If you want to have the result for different periods of time, you just need to add a slicer to your report. Or if you want to use a measure in another measure, you just need to use Measure Branching technique that Sam represented in different videos.

Regards/ Hossein

Hi @sedhosen,

Let’s suppose that a have an Area chart showing Sales Diff with a DAX like this:

Sales Diff =
IF (
ISBLANK ( [Sales] ),
BLANK (),
[Sales] - CALCULATE ( [Sales], DATEADD ( Dates[Date], -1, YEAR ) )
)

I want to:

  1. allow users to select scope (day, week, month, quarter, year) by changing the DATEADD interval using SELECTEDVALUE (?).
  2. allow users to select another metric (profits, orders) by changing what is measured (sales, profits, orders, etc).

Thanks for the explanation.

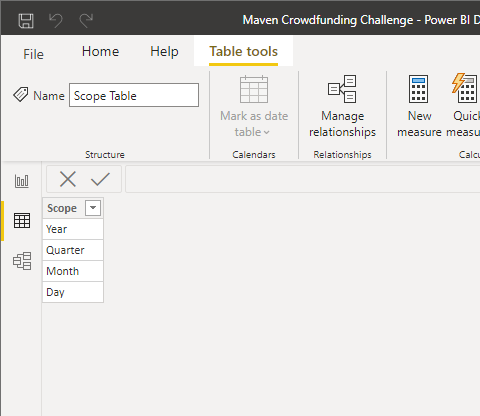
I created a one-column table with four rows (Year, Quarter, Month, and Day)
wwww

Then I created the following measure for calculating the dynamic amount based on the selected value of the table:

Pledged Money LY-LQ-LM-LD = 

VAR DateScope = SELECTEDVALUE( 'Scope Table'[Scope])

RETURN
SWITCH( TRUE(), 
DateScope = "Year",
    CALCULATE( [Pledged Money] , DATEADD( Dates[Date], -1, YEAR)),
DateScope = "Quarter",
    CALCULATE( [Pledged Money] , DATEADD( Dates[Date], -1, QUARTER)),
DateScope = "Month",
    CALCULATE( [Pledged Money] , DATEADD( Dates[Date], -1, MONTH)),
DateScope = "Day",
    CALCULATE( [Pledged Money] , DATEADD( Dates[Date], -1, DAY))
)

And then I used the following measure to have differences for various scopes:

 Pledged Money Diff =  [Pledged Money] - [Pledged Money LY-LQ-LM-LD]

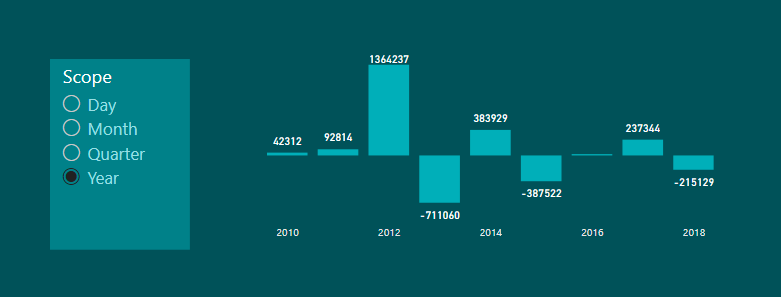
The result was like this:

When I click on different scopes, I receive different amount -that I think that is exactly what you are looking for.
But my questions are:

  • Are the results we will get are meaningful, for example by Month, or Day, when we have Year for the X-axis?
  • Since we cannot change the X-axis, what is the proper selection for it?

And about your second question, I think it is feasible using a method somehow like what I explained above for your first question. You need to create different measures for profits and orders, and then use switch function to have a new measure that will give you the proper result based on your selection for “Sales, Profit, or Orders”.

Regards

4 Likes

Thank you @sedhosen, that worked perfectly. I replaced that Calculate functions with measures so now it looks even better.

This is meaningful when the user selects the date scope. ie when I choose current quarter (Q2 2021) visual will display differences of this period compared to the scope I choose. I may need to compare that with the previous quarter (so I choose Quarter under scope) or with the same quarter lat year (so I choose Year under scope). Coupled with a date hierarchy, it provides all differences someone may need.

Already applied the method for different measures, so I can see differences of main metrics under any date scope.

Thank you once again.

1 Like

Happy that it helped you :blush:

And thanks for your explanations about the visuals.