Hi all,
I am creating a dashboard for employees I have a calendar table and employee table.
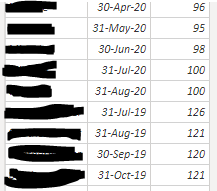
In the employee table I have 3 columns - location(Have 13 Locations), date(which is last date of the month) and total number of employees.

Now, the issue I have here is I have a date filter in the dashboard and I am using inbetween filter. and if I don’t have the last date of the month it shows blank. Please see my measure to calculate
“”*All Drivers = *
Var Current_month = MAX(‘Calendar’[Date])
RETURN
CALCULATE(SUM(‘Drivers ALL’[Value]), FILTER(ALL(‘Calendar’[Date]), ‘Calendar’[Date] = Current_month))""
Is there anyway I can make it dynamic? Like instead of 30/09/2020 in date filters I have 15/09/2020, it still shows September figures and so on. I have tried few different ways but doesn’t work.
Any help would be much appreciated.
Thank you
Manny
Hi @mannymalhotra,
I think you can easily achieve this by following:
- Create a EOM column if it does not exist in your calendar table. Then create a relationship between EOM column of calendar and ‘Drivers ALL’ table. This can be inactive relationship as well if you know how to use userelationship.
- Next, just modify your measure below and it should work with all dates.
“”*All Drivers = *
Var Current_month = MAX(‘Drivers ALL’[Date])
RETURN
CALCULATE(SUM(‘Drivers ALL’[Value]), FILTER(ALL(‘Calendar’[Date]), ‘Calendar’[EOM] = Current_month)) “”
In case of any issue, please elaborate and try to share pbix file. Cheers!
Hi @hafizsultan,
Thanks for your note. Yes it did worked but still slightly out. Only thing I changed from your measure is
FILTER(ALL(‘Calendar’{EOM]),
Also the issue now is if the date slicer goes one date back lets say 30/08/2020 instead of 31/08 then figures are shown as Jul not the August. Is there anyway we can get this worked as well?
Please see attached pbix report.
Thank you again for your help.
Cheers!
MannyTEST1.pbix (89.8 KB)
Hi @mannymalhotra,
I think your data model will work in this way. I have just changed it to use userelationship and it works.
All Drivers =

Var Current_month = MAX('Calendar'[Date])

RETURN

CALCULATE(SUM('Drivers ALL'[Value]), USERELATIONSHIP('Calendar'[End of Month],'Drivers All'[Date]))
Reason it does not work when you select 30th of August is that your data in drivers table has only data on 31st of August in August. Do you want to show data of 31st even any date of August is selected?
Cheers!
Hi @mannymalhotra,
I have created a bridge table to solve your issue. Now, it is working as you require.
Please find attached.TEST1_crossfilter.pbix (101.8 KB)
1 Like
Hi @hafizsultan,
Yes, I want to show August data during August month not just when it is 31/08/20.
Thank you!
Hi @hafizsultan,
It is almost there… 
Only issue is that I am showing the figures in card, not in matrix. So If I use another filter and put depot from drivers table and put your measure in the card then it adds the data up until that month.
Cheers!
@hafizsultan
What I am trying to achieve here is that the most recent months figures should show. Also if any other dates (not just EOM) then it should still show that months figures.
So for example from my previously attached pbix report
If I select 01/07/2019 - 15/08/2020 date and display it in card then it should show August figures (1206) only…
Regards
@mannymalhotra,
Here you go:
All Drivers =
VAR lastdate_all =
    CALCULATE ( MAX ( 'Calendar'[End of Month] ), ALL ( 'Calendar' ) )
VAR lastdate_current =
    MAX ( 'Calendar'[End of Month] )
VAR getlastdate =
    IF ( lastdate_all = lastdate_current, lastdate_all, lastdate_current )
RETURN
    CALCULATE (
        SUM ( 'Drivers ALL'[Value] ),
        CROSSFILTER ( 'Calendar'[End of Month], 'EndofMonth'[End of Month], BOTH ),
        FILTER ( 'Drivers All', 'Drivers All'[Date] = getlastdate )
    )
Cheers!
1 Like
Champion mate. Thanks a lot for your help. 
1 Like
Fantastic to hear that it worked for you. Cheers mate !!
1 Like


