Hi,
I have a couple of issues:
Firstly I can’t get my date to start in June which is the beginning of the financial year in one of my graphs (seems to work perfectly on the other one). Here are some screen shots:
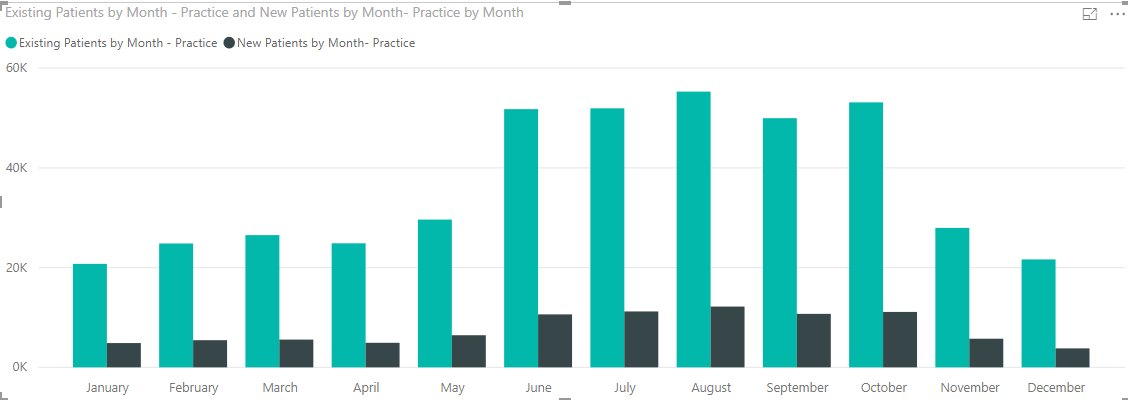
Currently the graphs for some months are doubling up i.e. Oct 2017 and 2018 are being combined.
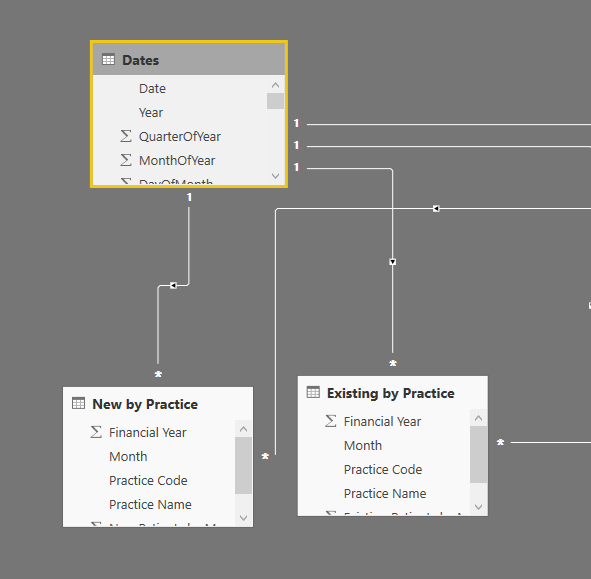
I thought that having the date table linked to the data tables would have been sufficient.
Any help would be greatly appreciated thanks,
Daniel