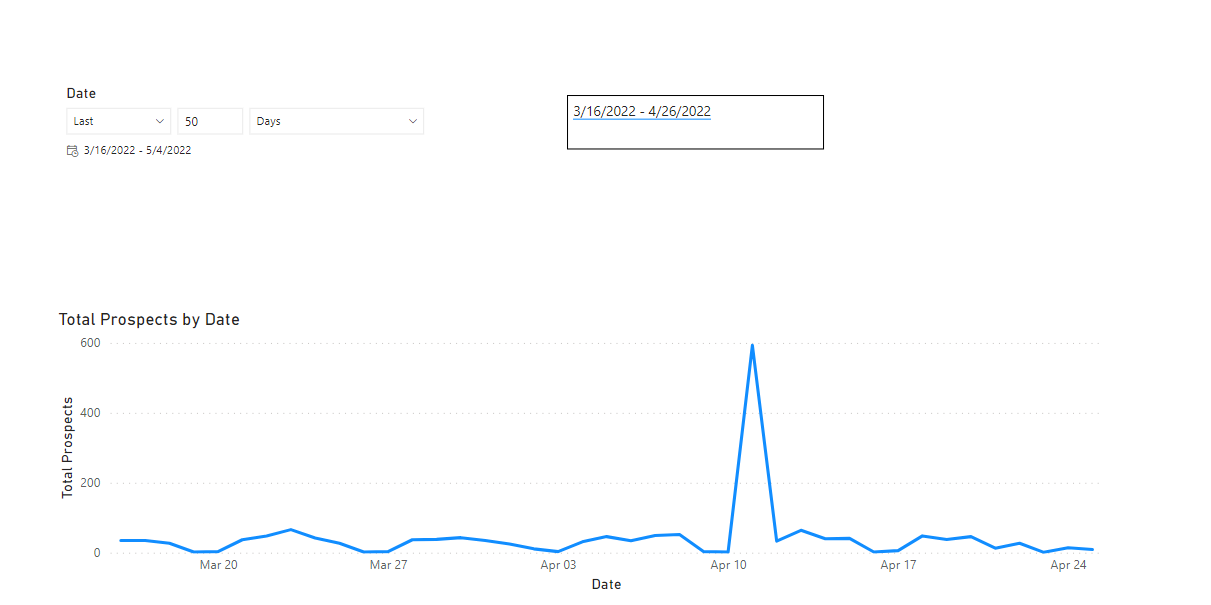
I was wondering how can I show the output of a date filter slicer. For instance, in the image below, i have the date range shown for the selected date slicer and I want to show the aggregate or total sum for that date range?
I have attached a WIP file in the Date Filter Output tab. Thank you.
It was rather simple, no DAX code involved. I just added a card visual to the report and put total sales in the fields value. When the slicer updated the card visual updated. It was an “oh dummy” moment for me.