I have a simple table with a Date and Time. I also have a calendar added so that i can easily filter by fiscal dates.
My goal is to add a filter so that i can count the number of tickets created per month, then add another visual so that i can show the number of tickets throughout the day.
My Process----
I took my date/time filed and added tow new columns (date only) and (time only). Then i connected my date calendar to the (date only) column thinking that this would allow me to sum up the number of tickets by the month. But for some reason that I can’t figure out, it won’t summarize the data.
On a second note, for my time. I want to remove seconds and only show it as hours/minutes. So that way i can create buckets to show every 30 minute interval.
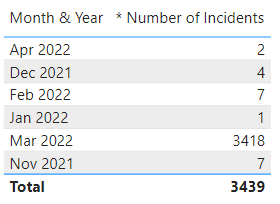
Your relationship in the fact table was on the [Created Date] field (which is a type date and time) not on the [Created Date - Date Only] field which is a date type field. That’s why no Month & Year values showed once corrected this is the result…
the [Created Date - Time Only] needs to be set to a time datatype
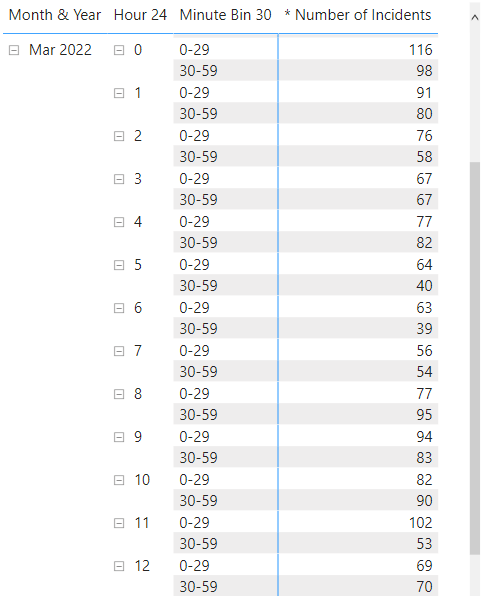
add a Time dimension table to your model
Lowering the granularity of the Time column by removing seconds, you can achieve as follows: Time.From( Time.ToText( [Time], “hh:mm”))
Oh my…
I’ve been doing PowerBi for over 2 years and I have
never assigned my Date Table as a “Date Table” in PowerBi.
I didn’t realize that was a thing, i just referred to them
as date tables because they held date information… lol…
By assigning the table as a “Date Table”… what does that actually do?
Thanks for pointing out my relationship error… that would
explain my first issue.
I will spend some time to learn how to use the time table. This one is new to me.