Dataset extremely slow due to calculated table

Hi everyone,

I have a report I created that helps purchasing.
The report lists all materials that throw a demand exception and all relevant info. It also shows the date, when the on hand quantity for each item on the list is supposed to jump to negative.
The report works for the user since once it is updated, everything goes fast and smooth.

The issue I’m having is that making any chances to the report takes forever.
Adding a new measure takes multiple minutes of waiting.

I ran some tests and believe that the calculation of the first date with negative inventory for each item is causing this issue. It seems to take a lot of resources and recalculates every time anything is changed.

Does anyone have any idea how to accelerate the calculation or doing it in a more efficient way?

Thank you very much for any advice.

Purch Dashboard EDNA.pbix (1.0 MB)
Data.xlsx (1.8 MB)

Bumping this post for more visibility.

Hi @AntrikshSharma, @BrianJ - Is it something you can help with.

@ankit Thanks! but @nico the PBI file that you have shared isn’t opening, can you please check that?

Hi @ankit ,

This is part of the file being extremely slow. If you wait about 5 minutes or so, it should eventually open.

Nico

Hi @Nico,

it is exactly what you thought, the calculated table for the First Day Negative Lookup causes the problem (see code below) : if you leave this calculated table out, the PBIX file appears normally.

See PBIX attached:
Purch Dashboard EDNA v2.pbix (1015.2 KB)

First Day Negative Lookup = 
    ADDCOLUMNS(
        SUMMARIZE('All items', 'All items'[ID]),
            "First Date negative", [First Date negative], 
            "Days until negative 2", IF(DATEDIFF(TODAY(),[First Date negative],DAY)<0,0,DATEDIFF(TODAY(),[First Date negative],DAY)),
            "Boolean Exception needs Attention", SWITCH(TRUE(),[Lead Time]=0,1,[# days until negative]-[Lead Time]<=0,1,0))

The First Day Negative lookup can not (?), at least not easy, find a date connection in the data model, and therefore in this form not recommended.

Deleting the table is the easiest part.
What are you missing when the calculated table is deleted ? What exactly are you trying to do ?
Out of stock ?

“Cumulated OHQ” is used in the measure “First Date negative”, in this calculated table.

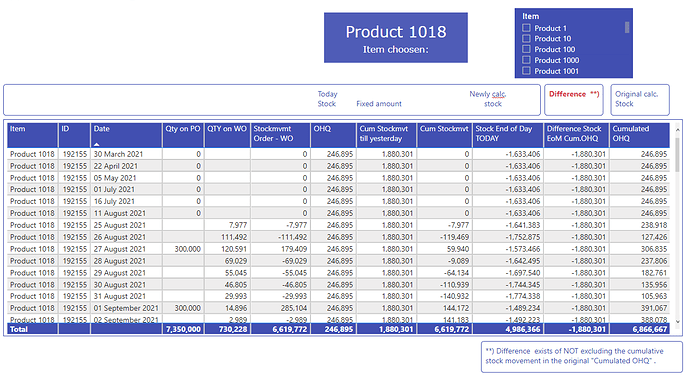
For some basic understanding I made a elementary report of product 1018 (see below) with “Cumulated OHQ”, which uses:

  • the tables “All items” (containing no date),
  • POs (with a Promise date)
    -/- and Workorder Consumption (with a ProdDate),
    ==which sums into Cumulated OHQ.

Could you explain what calculation exactly you are looking for ?

(PS I have little time, so my response might last a few days . . )
Kind regards, DS

image

Hello @Nico, good to see that you are having progress with your inquiry. Did the response from @deltaselect help you solve your inquiry?

If not, how far did you get and what kind of help you need further? If yes, kindly mark as solution the answer that solved your query.

Hi @deltaselect ,

Thank you so much for your answer.
I use this table to calculate the first date, that the inventory for this item will go negative.
I’d like to use it to compare it against lead time and then see, where I have an issue.
So if the days until first day negative is less than lead time, purchasing knows they will have to expedite material.
If there is no easy way to calculate this, I’d probably delete it.

Hi @nico (REVISED FOR WORKOUT PART TWO, SEE BELOW NEW POST)

It is possible to make the desired calculation completely out of measures, without the need of a calculated table, with a very acceptable speed.

Concept of a possible workout is first determine the current stock level as per today and secondly determine the net stock movement till the lead time. If the stock level plus the net stock movement till the lead time is negative, warn the purchase department, this reporting process is done on a daily base.

The past can not be changed, the purchase department can only act upon available forecast information as from today.
Could you comment if this concept-interpretation is correct and if the the work-out meets your information requirements ?

PBIX attached : REVISED FOR WORKOUT PART TWO; SEE NEXT POST BELOW
Purch Dashboard EDNA v8.pbix (510.7 KB)

Workout part one : determine current stock level as per today

Determine actual stock level ( on a daily base) can be done by taking the current stock level, deduct the cumulative stock movements till yesterday and add back the cumulative stock movements.

Measures as follows:

OHQ = SUM(‘All items’[ONHAND])

Cum Stockmvt till yesterday = //results in a fixed cumulative movement over all days till yesterday 
Var StockYesterday =    CALCULATE( [Stockmvmt Order - WO], 
                            FILTER( ALLSELECTED(DateLT[Date]), DateLT[Date] <= TODAY() - 1))   // yesterday )))
Return 
IF( ISBLANK([Stockmvmt Order - WO]), BLANK(), StockYesterday)
Cum Stockmvt = 
Var CumStockMvmt =    CALCULATE( [Stockmvmt Order - WO], 
                            FILTER( ALLSELECTED(DateLT[Date]), DateLT[Date] <= MAX( DateLT[Date])))

Note 1: cumulative values will appear when using MAX at "FILTER( ALLSELECTED(DateLT[Date]), DateLT[Date] <= MAX( DateLT[Date]))) ", when using specific date values, like TODAY(), the same cumulative value till the specific date value is calculated for every single row/date ( see also picture 1 below at “Cum Stockmvt till yesterday”

Note 2: the original stock calculation “Cumulated OHQ” does not exclude the stock movement till today, this must be excluded as the stock level of today already includes the stock mutations till today.

Note 3: the data model is not changed, it is important that all date keys have date values (not text values)

Note 4: the measures used can be found in the measure group DS Stock Today Calc, an example can be seen below of Product 1018, and in the PBIX file, page 1.

Workout part two : determine next stock movement till lead time, check daily if out of stock

Obviously the Out of stock estimation highly depends on the accuracy of the forecast of stock PO and stock WO.

  1. As the lead time stock movement table does not have a date (and missing date context) the Stock End of Day Today is not correct in “Purch Dashboard EDNA v8.pbix” , this is corrected in next post below and should be derived of the original OHQ, from the All Items table, assumed it is representing the stock at the end of each day and refreshed on a daily base (!).

The correct DAX formula should be just the stock as per today:

OHQ (Stock EoToday) = 
Var OHQty = SUM('All items'[ONHAND]) 

Determine the net stock movement till lead time:

Cum Stockmvt tomorrow till lead day = //results in cumulative stock movements from today End of Day till the Lead Time in days in the future
Var CumStockMvmtToday =    CALCULATE( [Stockmvmt Order - WO], 
                            FILTER( ALLSELECTED(DateLT[Date]), DateLT[Date] <= TODAY() ))   // End of Day today )))
Var LeadTime = SELECTEDVALUE( 'All Items'[Lead TIme])
Var CumStockMvmtLeadTime =    CALCULATE( [Stockmvmt Order - WO], 
                            FILTER( ALLSELECTED(DateLT[Date]), DateLT[Date] <= TODAY() + LeadTime))   // today + lead time in days in the future )))
Var StockmvmtTillLeadDay = CumStockMvmtLeadTime - CumStockMvmtToday
Return 
IF( ISBLANK([Stockmvmt Order - WO]), BLANK(), StockmvmtTillLeadDay)

If the current stock level and the stock movement till the lead time is negative, a warning is sent to the purchase department, triggered by a base comparison measure, which could be further filtered:

Purchasing Warning = IF( [Expected Stock after Lead TimeTT] < 0, “Warn Purchase department”, BLANK())

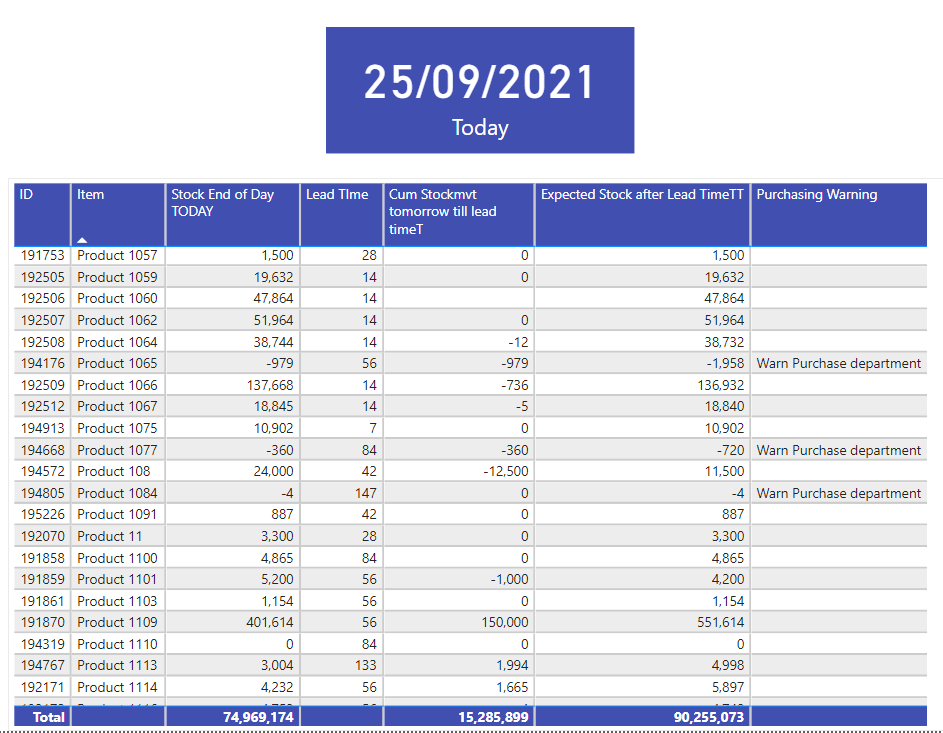
Note: the majority of the Purchase warning messages appears by already negative current stock levels, what should not be possible, as inventory can not be negative. NOT CORRECT; CAUSED BY WRONG STOCK FORMULA

Two reports attached:

Report 1 Calculation of current stock level

Report 2 Expected stock level per end of the lead time, with some purchase warnings

`

Could you comment if the concept and the work-out meet your information requirements ?

Kind regards, Delta Select

@deltaselect
Wow, this is an extensive answer. This will take me a while to go through and understand everything but your concept makes a lot of sense and I believe that should work.
I will mark this answer as a solution :slight_smile: .
Thank you very much Jan!

Hi @Nico,

Thanks, nice to hear that the concept is good.

After a night of sleep, I review my work, and had to make one major correction . . now I am pretty convinced the data in the reports is correct.
I checked with product 1018, and product 1396 with only a few mutations.

See also the renewed PBIX :
Purch Dashboard EDNA v11.pbix (492.9 KB)

See measure group “DS Lead Time Calc” and Page 2 of the PBIX:

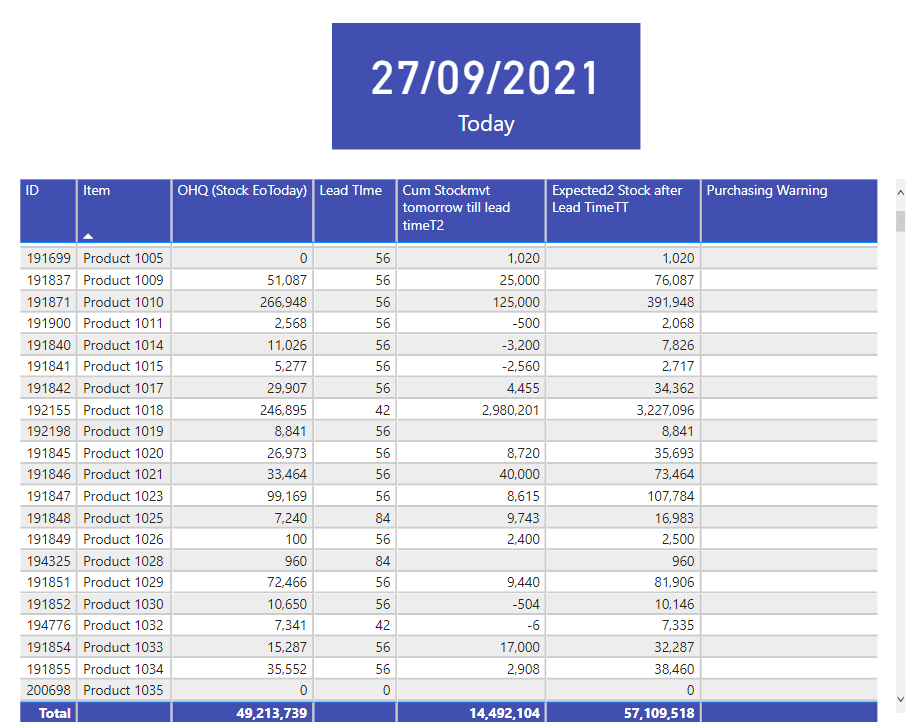
  1. As the lead time stock movement table does not have a date (and missing date context) the Stock End of Day Today was not correct, it is corrected and now exists of the original OHQ, from the All Items table, assumed it is representing the stock at the end of each day and refreshed on a daily base (!).

    OHQ (Stock EoToday) = 
    Var OHQty = SUM('All items'[ONHAND]) 
    
  2. However the outcome remains the same, I changed the DAX formula to calculate the cumulative stockmovement from tomorrow till the lead time, as I believe this formula is faster.

    Cum Stockmvt tomorrow till lead time2 = 
    Var LeadTime = SELECTEDVALUE( 'All Items'[Lead TIme])
    Var DatesSelected = CALCULATETABLE( VALUES( DateLT[Date]), 
                     FILTER( DateLT, DateLT[Date] > TODAY() && DateLT[Date] <= TODAY() + LeadTime))
    Var CumStockMvmtLeadTime =    CALCULATE( [Stockmvmt Order - WO], 
                                DateLT[Date] IN DatesSelected, REMOVEFILTERS( DateLT[Date]))  
    return CumStockMvmtLeadTime 
    
  3. Additional total measure needed for correct totals:

    Cum Stockmvt tomorrow till lead timeT2 = 
    SUMX(
        SUMMARIZE( 'All Items' ,  'All Items'[ID] ,  "@Totals" , 
            [Cum Stockmvt tomorrow till lead time2] ) ,    [@Totals] )
    
  4. See below the revised report, which can be found at Page 2 in the attached PBIX.

  5. Attached is also an Excel file with an audit if the calculated stock movements till the lead time of product 1018 and the total calculations are correct.
    data1018 analyse.xlsx (158.3 KB)

    If you are (also) convinced that the stock movements till the lead time are calculated correctly, you may decide to get rid of the audit report on page 1 of the PBIX completely.

  6. Obviously the figures changes every day, as the date range varies every day (start 27 Sept is tomorrow 28 Sept)

Kind regards, JW

Hi @deltaselect ,
I started to look at this and have one question regarding your concept.

Here’s a scenario:

Today: 10/06/2021
Item 1:
Qty on Hand - 200
Daily usage - 40
Lead time - 15 days
Next purchase order incoming: 500 pcs in 10 days:

In this scenario the qty would be:

10/06/2021 - 200 pcs
10/07/2021 - 160 pcs
10/08/2021 - 120 pcs
10/09/2021 - 80 pcs
10/10/2021 - 40 pcs
10/11/2021 - 0 pcs
10/12/2021 - (-40) pcs
10/13/2021 - (-80) pcs
10/14/2021 - (-120) pcs
10/15/2021 - (-160) pcs
10/16/2021 - 300 pcs (-200)+500 from PO
10/17/2021 - 260 pcs
10/18/2021 - 220 pcs
10/19/2021 - 180 pcs
10/20/2021 - 140 pcs
10/21/2021 - 100 pcs

So my question here is:
Within lead time we would be good, but we would run negative during the lead time and the action would be, that the purchasing department has to move in the PO of 500 pcs to arrive in 5 days, not in 10. In your calculations, would this be caught or not?

I’m still trying to understand the DAX code so apologies if the answer is in the code :slight_smile:

Thanks,
Nico

Hi @Nico,

In my calculation that is not caught … is fast purchase possible then ?

In my concept it is assumed that fast ordering is not possible and new inventory from your example can only arrive 15 days after 6 October, at 21 October, so the shortage will always happen.
The shortage as shown in your example should already have appeared earlier, in the daily report at 26 September.

Here appears the limitations of the concept:
–how accurate is the forecast comparing the actual mutations;
–is the forecast updated on a daily basis to align with the actual stock mutations
(image if there are thousands of products and big lead times, impossible to make an accurate daily forecast (?))

Consideration of a practical solution:
if the stock level goes below a minimum required level, give a warning (iron stock level warning), this can be done simply comparing the daily stock levels with the iron stock level

Long explanation short :
I hope the concept behind the given work-out is clear.

What do you want, go back to your initial question " a list of items with a date, when the on hand quantity for each item on the list is supposed to jump to negative. ", based upon the prognosis, can an item be ordered faster then the lead time ?

Kind regards, Jan vd Wind