Title: Visualizing Victory: Crafting Compelling Data Visualizations
Description:
Data visualization is more than just creating charts; it’s about telling a story with data. In this workout, dive into the art and science of data visualization, exploring techniques to transform raw data into meaningful visual narratives.
Scenario:
You’re part of a data team at a health organization. With a dataset on global health metrics, you’re tasked with creating visual representations to communicate important trends and insights to stakeholders. How will you approach selecting and designing the right visualizations?
Objectives:
By the end of this workout, you should be able to:
-
Understand the importance of data visualization in data analysis.
-
Choose appropriate visualization types based on the nature of the data and the insights you wish to convey.
-
Recognize best practices for ensuring clarity, accuracy, and impact in your visualizations.
Interactive Task:
Given your understanding of data visualization, answer the following:
-
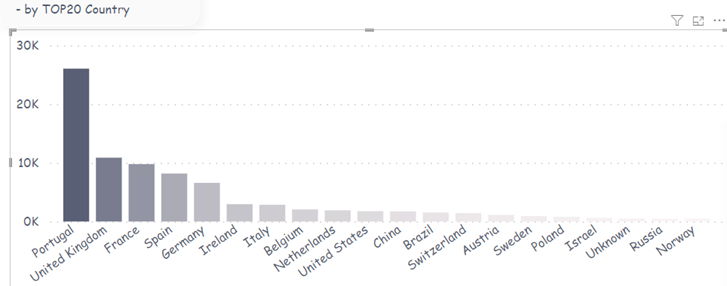
You have data on the average lifespan of individuals in various countries. What type of visualization might be most effective to show a comparison among countries?
- Your Suggestion: ________________________
-
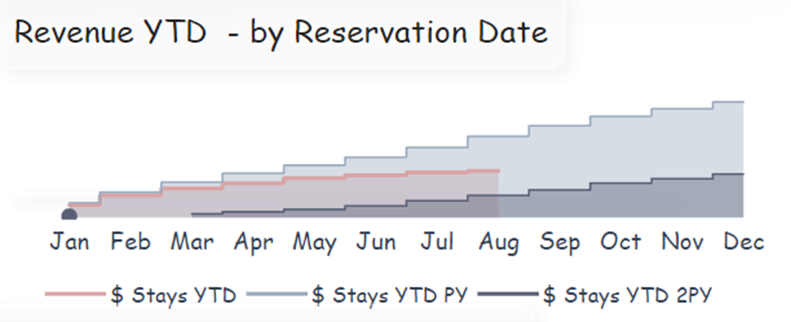
You want to visualize monthly sales data over a 3-year period to identify trends. Which visualization would you lean toward?
- Your Choice: ________________________
-
In ensuring that a data visualization is effective, why might you want to avoid using too many colors or overly complex designs?
- Your Answer: ________________________
Questions:
-
Which of the following is a key reason for using data visualizations in data analysis?
-
i) To make the data look more attractive.
-
ii) To provide a clearer and quicker understanding of the data’s patterns, trends, and insights.
-
iii) To use up space in a report.
-
iv) Because it’s a mandatory step in all data projects.
-
-
When visualizing data over a continuous time period, which type of chart is commonly used?
-
i) Pie chart.
-
ii) Bar chart.
-
iii) Line chart.
-
iv) Scatter plot.
-
Duration: 20 minutes
Difficulty: Beginner
Period:
This workout is released on Tuesday, October 10, 2023, and will end on Friday, October 20, 2023. But you can always come back to any of the workouts and solve them.