![]() What sorcery is this? My squatter chart does not have error bands…
What sorcery is this? My squatter chart does not have error bands…
1 Like
In my version it doesn’t have it either ![]()
So, when you don’t have this feature what you need to do?
1 Like
… I guess we have to use a line chart and put exactly over the scatterplot …
2 Likes
You got the idea
1 Like
![]() the illusionists strike again
the illusionists strike again
ok let’s keep it as the next challenge
![]()
by now…
please find attached my solution to the original workout.
I think scatterplots are very cool !!!
ciao !
Workout 012 - Scatter chart Quadrant highlight - Roberto Ravani OK.pbix (453.9 KB)
3 Likes
Hello Friends!
Find below my origin visualization set (PBI file may include some additional tables / measures that was not used to create this particular set of visualization).
Workout 012 - Gustaw Dudek.pbix (1.4 MB)
Have a great day!
6 Likes
![]() This column chart magic needs some serious deconstruction and thinking about
This column chart magic needs some serious deconstruction and thinking about ![]()
1 Like
OK, I’m having a hard time re-constructing the exact steps and necessary additional measures to create the background chart. Is there any chance you’ll make a tutorial in the near future?
1 Like
@Noemi
Here is my approach (my very first idea how to create such effect): https://www.linkedin.com/feed/update/urn:li:activity:7076963694298963968/
I also genuinely recommend to check @AlexandreAndrade approach, which is a bit different on level of constructing the bottom layer chart (background), but to some extend it might be treated as a simpler solution (in absolutely positive meaning).
2 Likes

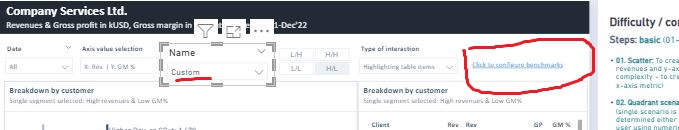
Hello,
How it is interacting Slicer while selecting Custom option
and its popup ( click to configure benchmarks ) text Button and while clicking None, average, medians and its disappear
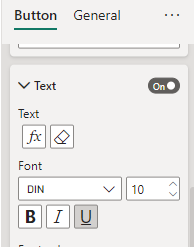
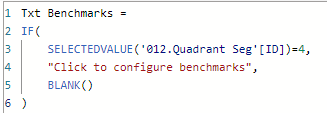
Create a measure to hide/show the text button if the “custom” are selected. Likes this:
Hi,
I can’t save my bookmark to hide Group 1.
Could you help me please.
Thanks.
Try with All visuals instead of Selected visuals in the bookmark’s settings when you update it.
1 Like