Data Visualization Workout 010 - Cost Analysis - Small Multiples

Workout 010 – Cost Analysis (Small multiple column chart)
Difficulty rating: 3.0 out of 5


Intro note
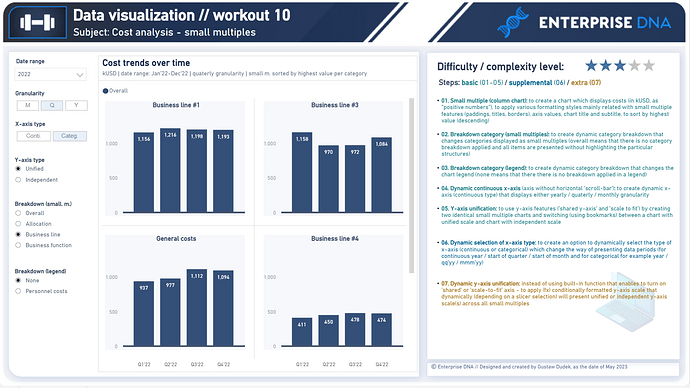
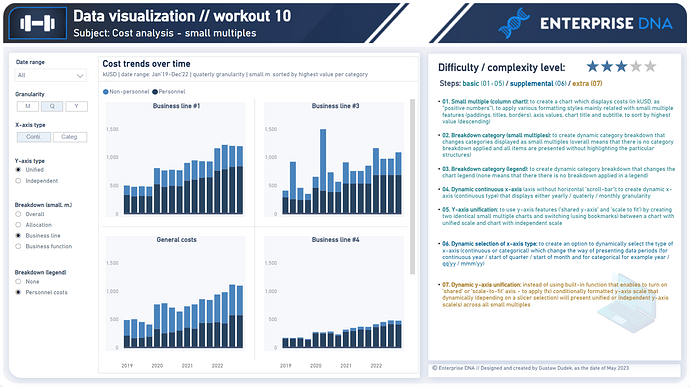
This workout combines various visualization techniques. The most important part of the workout is practice - entries does not have to include every element or functionality to be still considered as great . Please pay attention to the list of functionalities (provided in the screenshoot and in published-to-web report), which includes ‘basic’ elements (1st-5th point), supplemental (6th point) and extra (7th point). I would kindly recommend to review them before executing green/blue/orange points to provide proper plan and flow of your work.

A good starting point is to implement first 5 basic points by creating the small mutiple column chart and by applying various formatting options and various dynamic functionalities (field parameters). Realizing further points (blue/orange) will provide additional technical practice.

**Following workout bases on the “new” data source. Not all columns provided in the dataset have to be used in that particular workout, e.g. I used only specific ones within field parameters (“category breakdown”). Feel free to use other additional columns / categories if you’ll find it useful.

**Also, feel free to use your entries as a part of your project portfolio, if it’s instrumental in realizing your goals.

Additional notes

Data source:
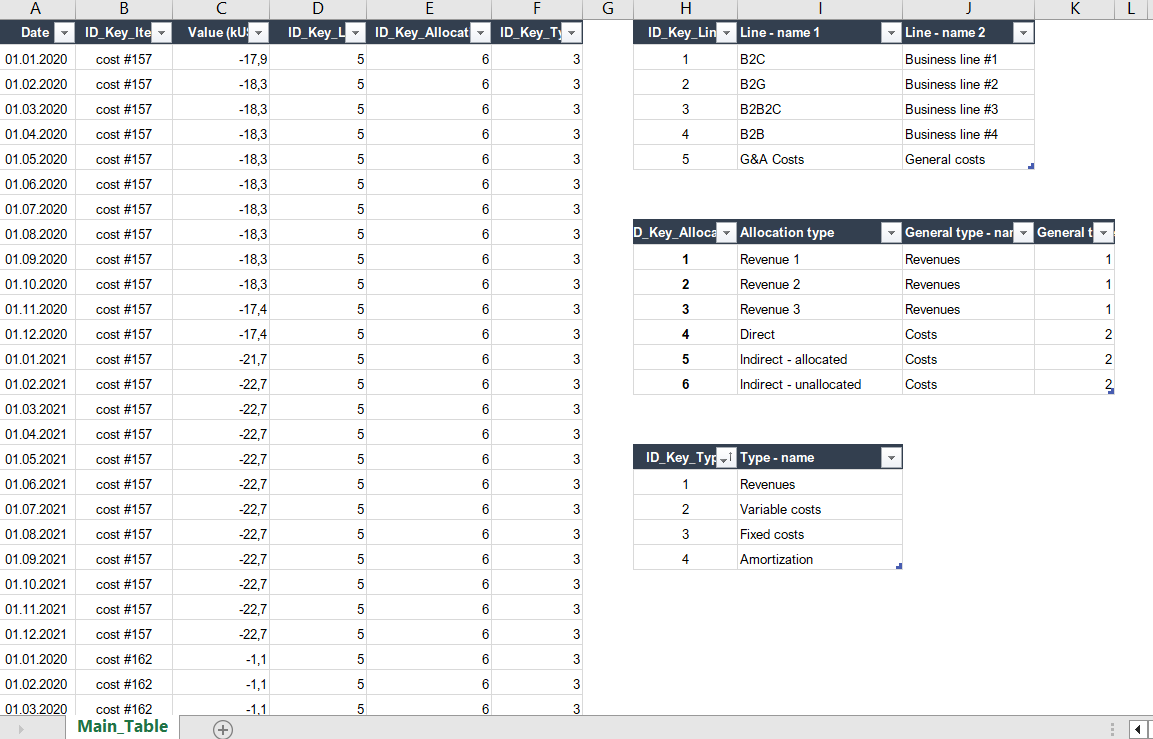
5 separate tables:
1 fact table (date / value as negatives - to be inverted to positive / key IDs)
4 dim tables (business line / allocation type / type / structure by kind)
Feel free to ask if you have any additional questions regarding the data-source.


Goals

In this workout, using the supplied dataset and reviewing the provided interactive report (link below) we are going to replicate the set of visualizations (small multiple column chart and slicers). Also, please feel free to add any extra visual if you would like to (provided that core visualizations are included in the first place).

010 - Workout - Business line - small multiples.xlsx (267.4 KB)

Core actions (practice) :

    • Getting familiar with various formatting options related with small multiples
    • Incorporating field parameters for various purposes (category breakdown, legend, x-axis)

Submission

Please load the supplied data (xls file) into a Power BI file, replicate visualizations (considerating list of points in the introductory report screenshot and the general design and functionality provided through interactive published-to-web report), and reply to this post including the screenshot (or a gif) of your solution along with the pbix file (please, include name or EDNA forum nick in the pbix name).

Period

This workout is released on Tuesday May 30, 2023, and the author’s solution will be posted on /Tuesday - Wednesday 06-07 June, 2023.

Additional materials

Link to the interactive dashboard:

Have a great fun!

Best regards!
1 Like

Wow, thanks a lot Sir!

1 Like

Hello,
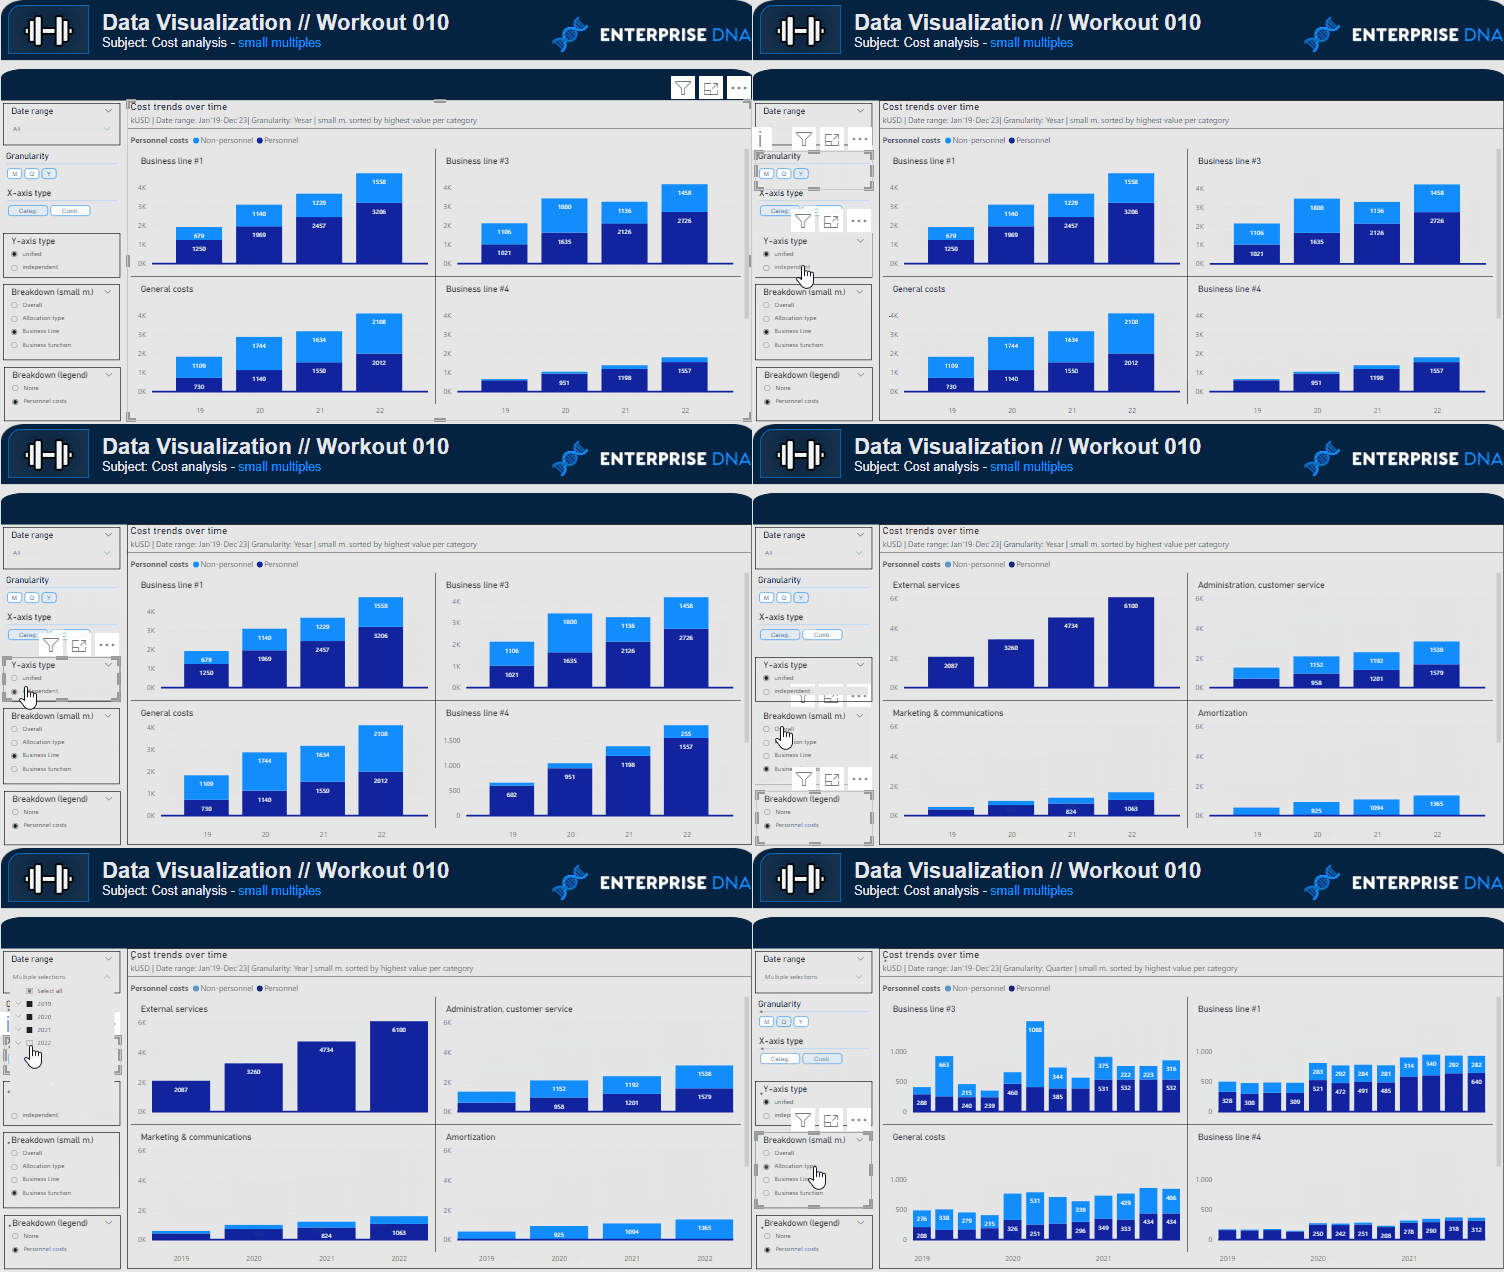
Here is my solution.
I’ve completed all of the tasks, but I can’t wait to see how to get it done in a more elegant way, especially the dynamic formatting of the Y-axis :slight_smile:
AS_Workout10

Aleksandra_Workout10.pbix (371.6 KB)

6 Likes

Hi @Aleksandra
Excellent entry! Lot of great effort (dax formulas, clean design). I like everything here, especially how you handled the “overal” category in “breakdown / small multiple”. In your solution it actually gives you only a single chart when selecting this option and it looks cool. From the design perspective, it looks even better than in my case, where I displayed a small single chart while remaining other grid sections empty!

Thank you for participation!

2 Likes

hi,
please find attached my solution.
Thanks to Aleksandra I fix an issue on the max Y-axis measure.
Very cool the Overall measure to handle the Overall category !
Thanks Gustaw for the opportunity to work on small multiples.
ciao !

workout 10 RR

Workout 010 - Small Multiples - Roberto Ravani ok.pbix (481.1 KB)

4 Likes

Awesomeness

2 Likes

as usual great work

2 Likes

many thanks

1 Like

Hi,
Here is my solution. Dynamic Y-axis via DAX is still challenge for me :slightly_smiling_face:
Many thanks for new practice and knowledge.

Workout 010_EDNA_AngelinaMihejenkova
Workout 010_EDNA_AngelinaMihejenkova.pbix (558.7 KB)

4 Likes

Wonderful!
Y-Axis unification is a bit tricky / complex, especially if we have a few granularities and a few categories (breakdowns). Using built-in small multiple feature (scale to fit / shared y-axis) is an effective simplification. “Dax” unification is helpful if we’d like to skip bookmarks (or to save them for other purposes).

Great work as always, and thank you for participation!

1 Like

@Gustaw thanks for another challenging workout. I got stuck for a while on the x-axis which I solved by copying from @Aleksandra :pray: :pray: :pray:
I looked at y axis but no time to get my head around that one.

Workout #10 Small Multiples Kim Cook.pbix (633.7 KB)

3 Likes

@KimC I am glad to know that I have helped in some way and thank you for your sincerity :wink:

What workout did you copy from?

1 Like

Ooops, wrong name :upside_down_face:

1 Like

Hello Friends!

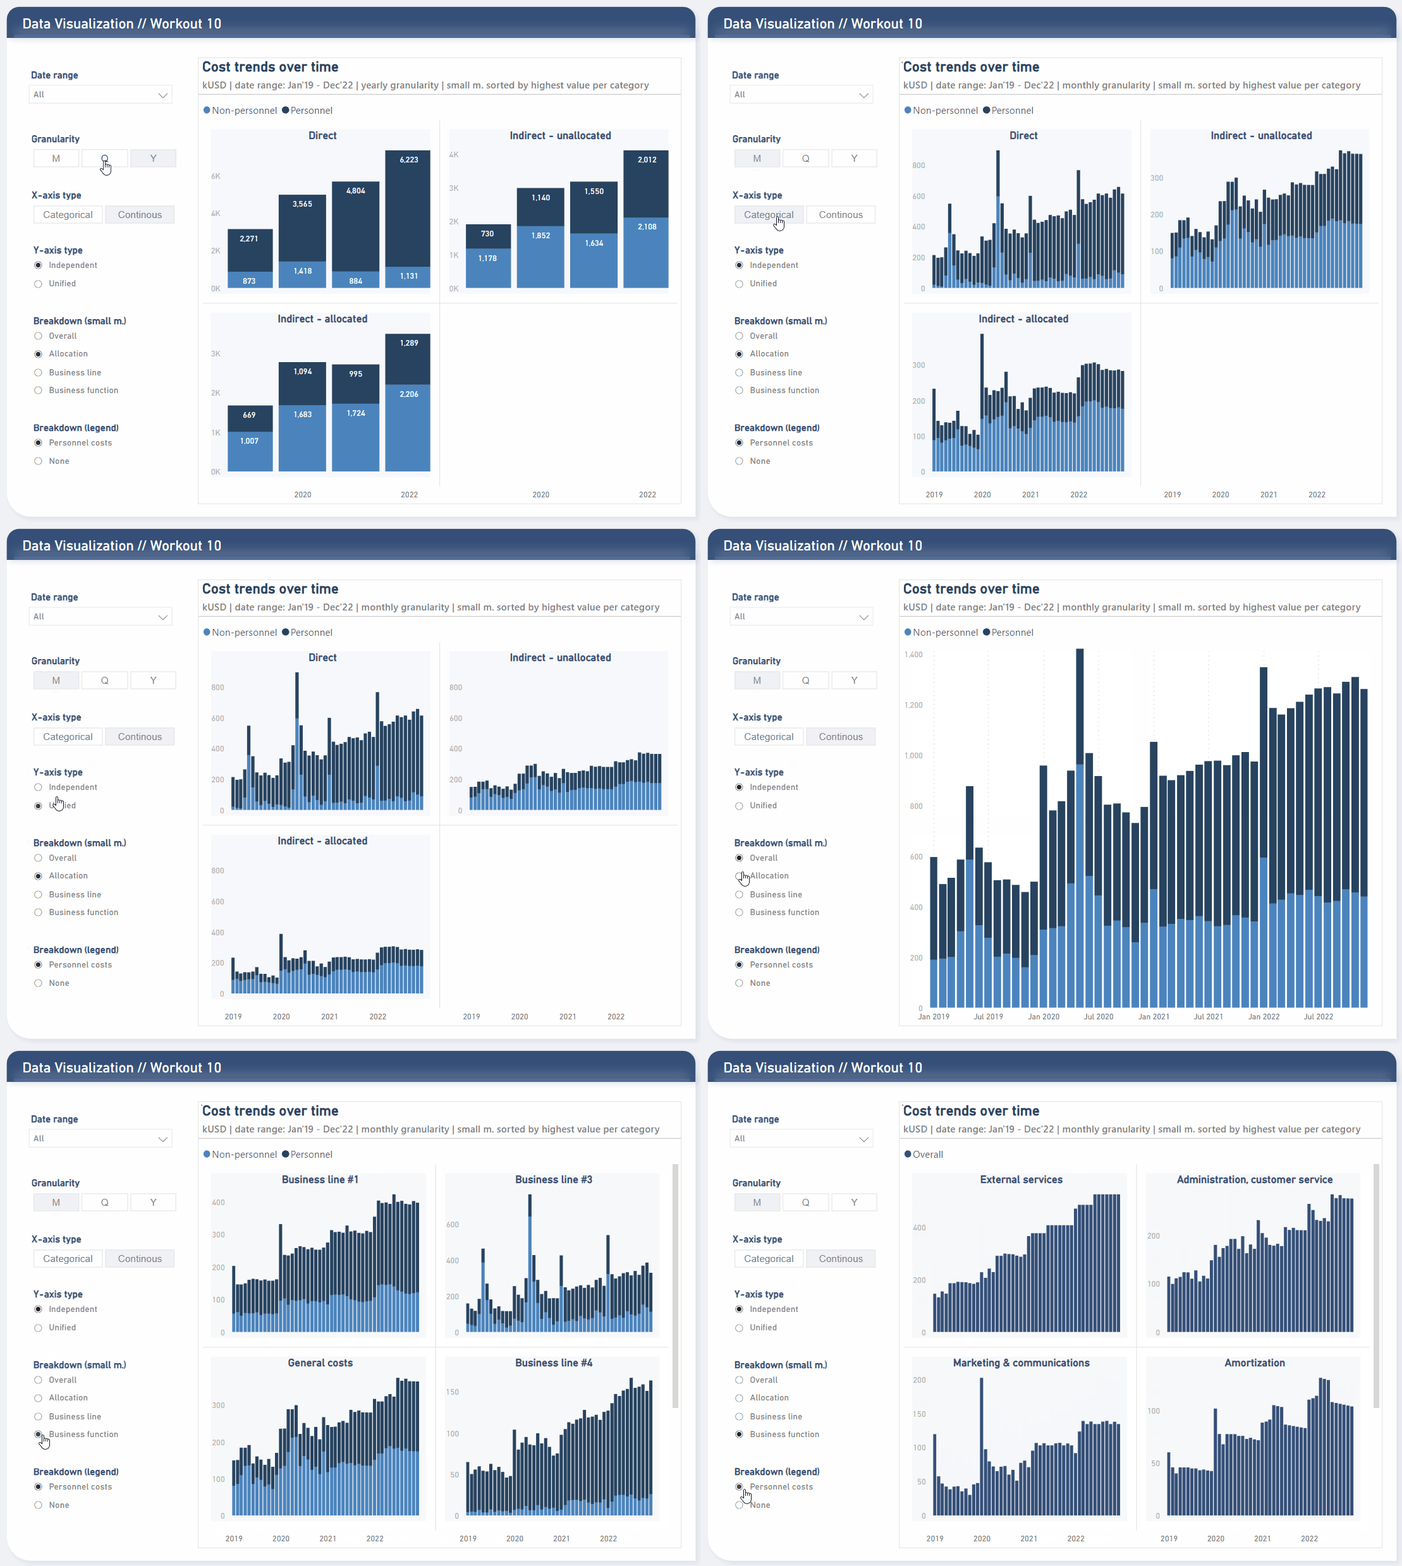
Find below my origin visualization set (PBI file may include some additional tables / measures that was not used to create this particular set of visualization).
Workout 010 - Gustaw Dudek.pbix (1.3 MB)

Have a great day!

2 Likes

Hi @Gustaw ,

It’s challenging for me to keep up with the weekly pace, but I thoroughly enjoy replicating and understanding all the workouts.

Thank you for your work.

Remi

hi @Gustaw ,
It is possible that the source file of the solution may not be exact?
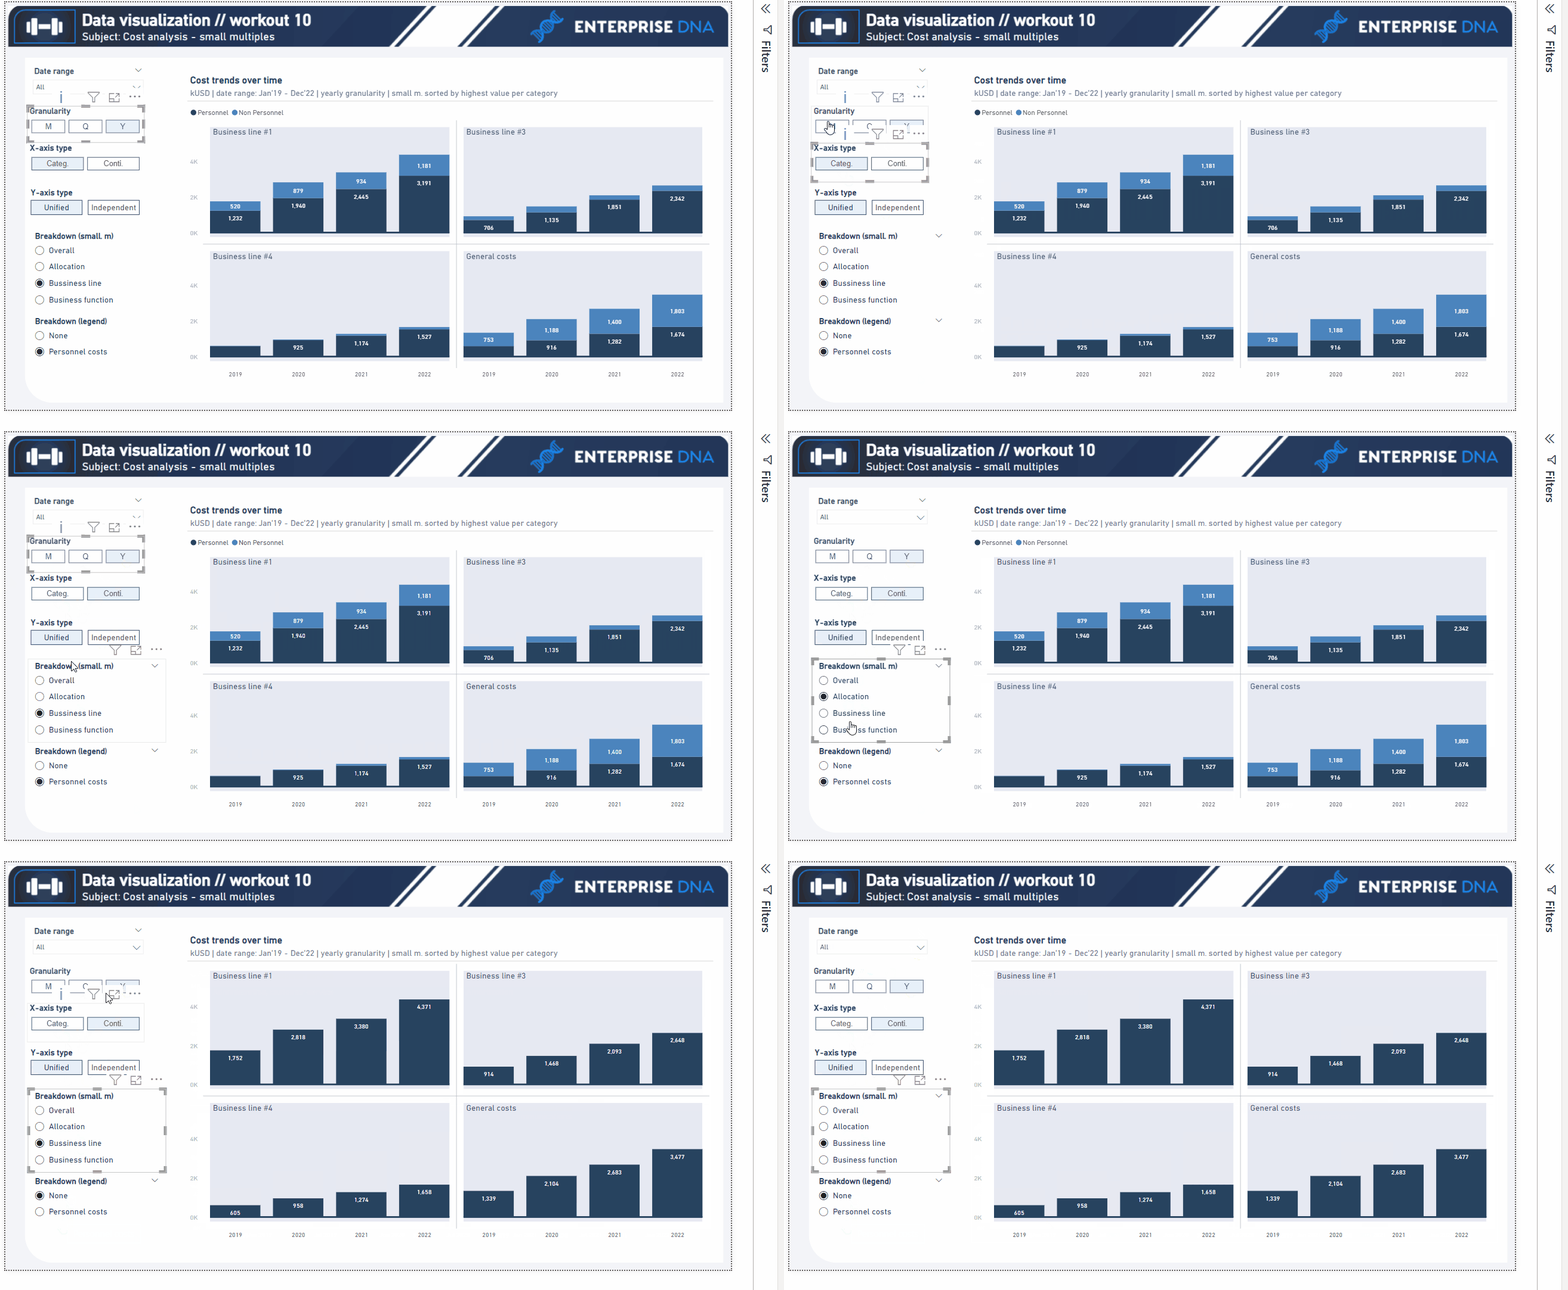
Because I have some differences in this amount.
Thanks.
Remi

Hello Remi.
Yes, your assumption is 100% correct.
I’ve changed the numbers / categories a bit when creating workout 011 and upload 010 workout with changes, that’s why you can see different results in my shared pbix comparing to origin dataset in workout 010. But don’t worry at all - the most crucial are the functionalities and the numbers are more irrelevenat (as long as they present correct results regarding the shared origin datasource).

1 Like

Thank you for your feedback Remi. Really great to hear that you enojoy working on this data vis workouts. I’m aware that some of them might be quite time-consuming. If you would have any aditional feedback - I’ll try to adjust some aspects of the workouts accordingly (it also refers to all other feedback from this incredible workout group :slight_smile: )

1 Like

Great work @Kim!

Looks and works great!
Thanks for participation Angelina!