Data Modelling Workout 08 - Times Table

Difficulty Rating: 3 out of 5

Data Modelling Workout 08 - Times Table

Period data is often provided with date values only, and this is wholly sufficient when the analysis periods are one day or longer. The analysis of intraday periods by definition needs a time component, and such a dataset often contains a single date-time value. This workout explores the use of a dedicated [Times] table to enable the analysis of intraday periods.

Goals

  • • create a dedicated [Times] table
  • • extend the raw data with both a dedicated time value and a dedicate date value
  • • extend the raw data with a time key
  • • create a star schema data model from the referenced tables using only key columns for linking

Tasks
Produce a Power BI file that:

  • • creates a [Trips] fact table from the NYC Taxi 2013 sample data provided
  • • creates a [Times] dimension table from the Enterprise DNA Time Table (both link and code provided)
  • • (as in data modelling workout 02) creates a [Dates] dimension table with the following characteristics:
    • • uses a function created from the Enterprise DNA Extended Date Table code (both link and code provided)
    • • uses parameters to determine the earliest and latest order dates in the trips data
    • • uses parameters to determine the final date range (full years covering the earliest and latest trip dates)
    • • (the end date should be 1 year later to allow for forecasts)
      • creates a [Key Measures] table to house the DAX measures created from the DAX data provided
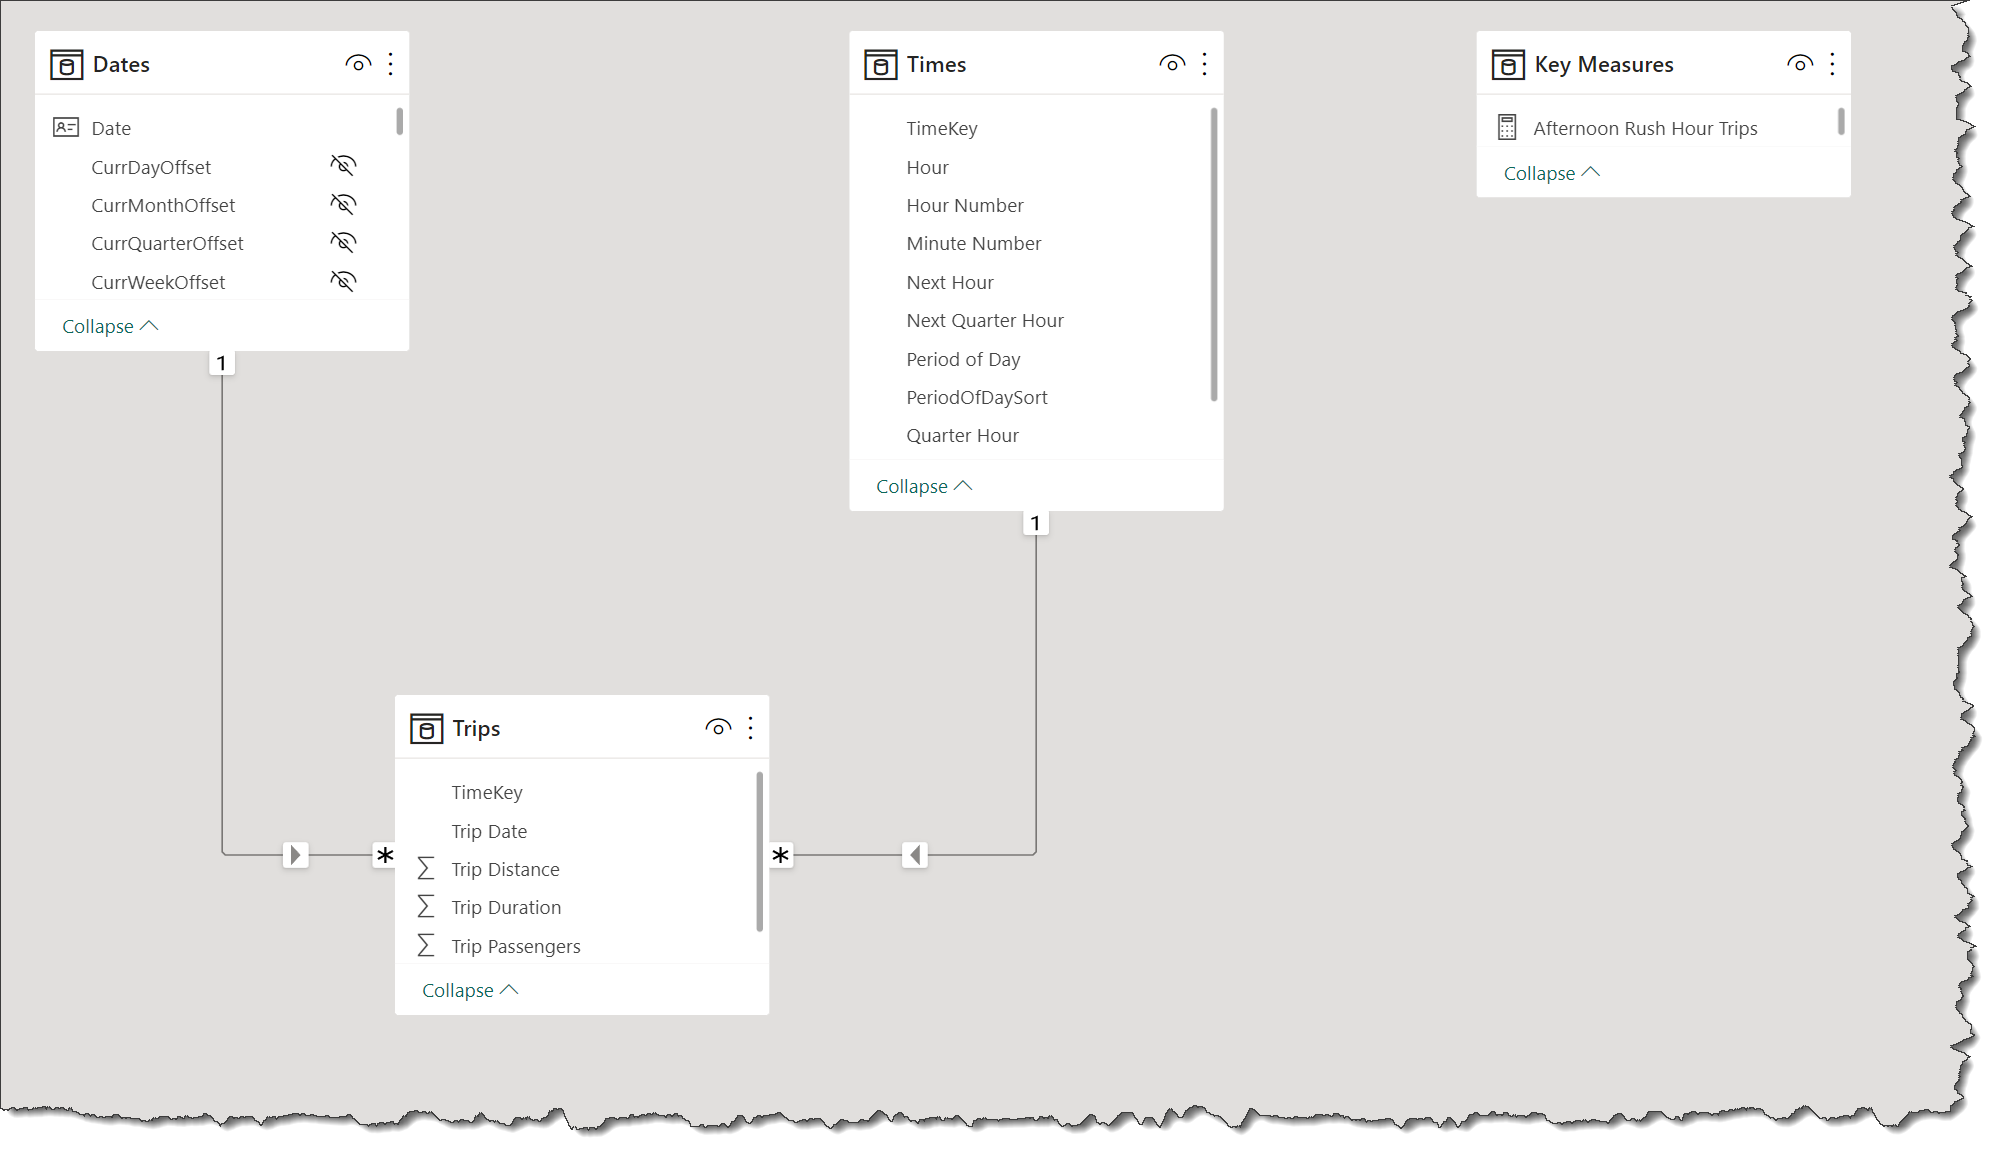
      • links the [Times], [Dates], and [Trips] tables into a star schema data model
      • includes slicers, a matrix, and cards to showcase the [Times] and [Dates] tables “in action” (i.e., while making slicer selections)

Notes
• use only the DAX code provided; do not modify nor create additional measures or calculated columns
• (data source: a subset (approx. 800,000 rows) of the Microsoft [NYCTaxi_Sample] sample database)

Submission
Using the only the data and DAX files provided, create your solution, and reply to this post. Upload the following:

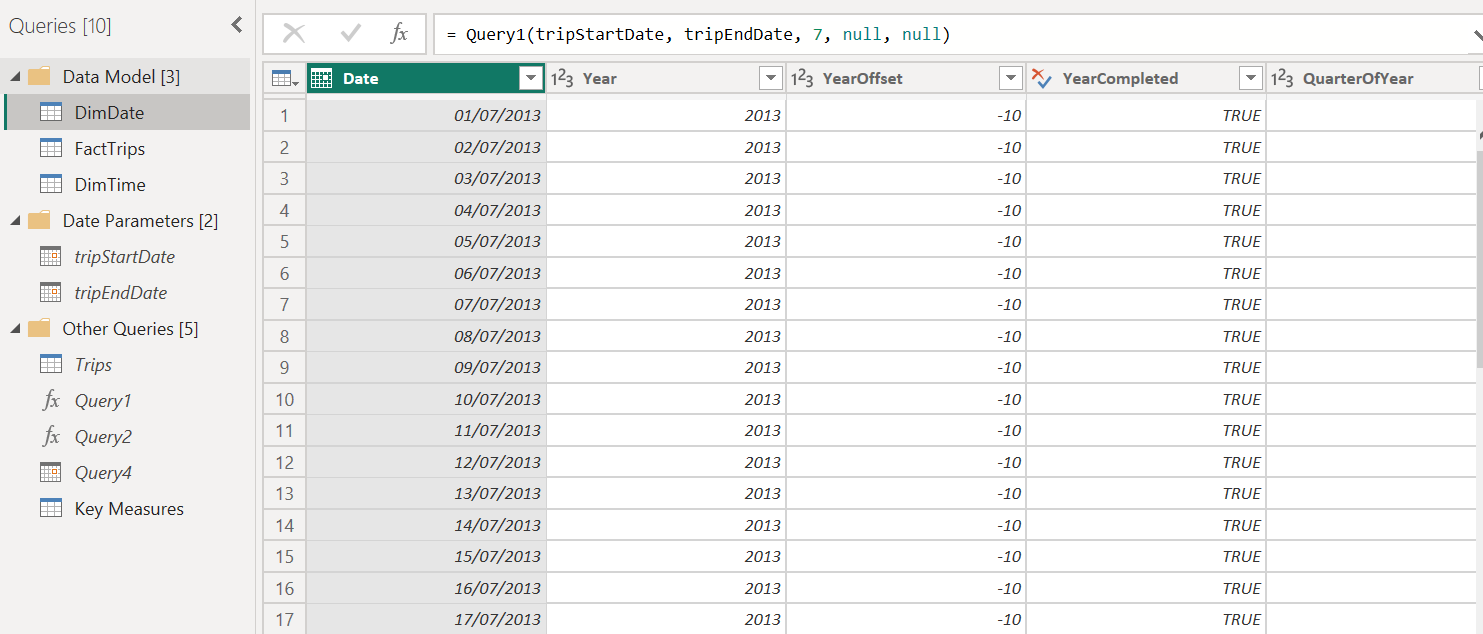
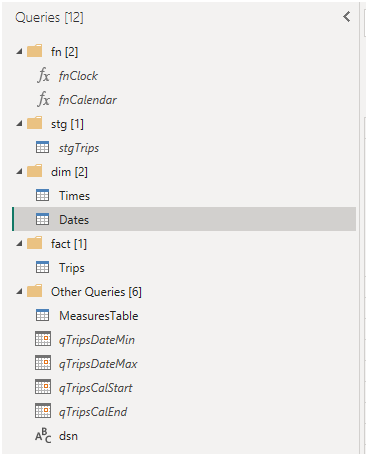
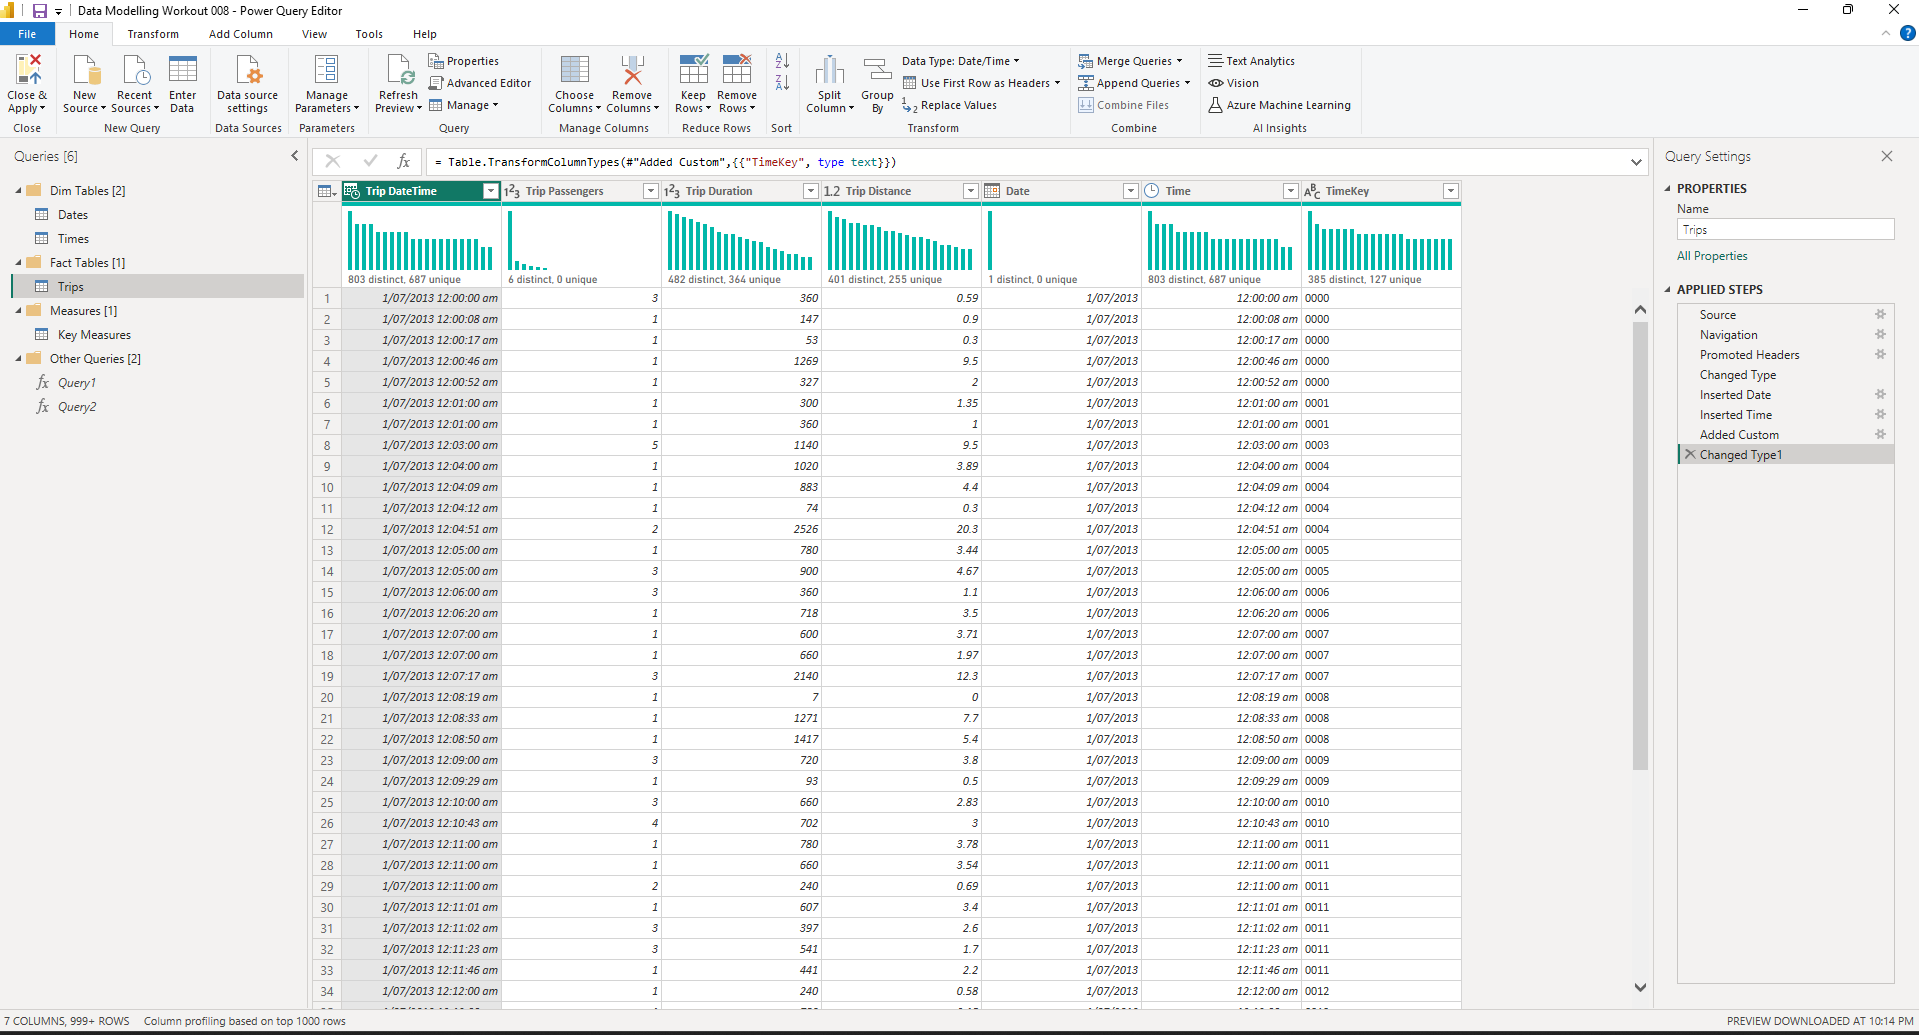
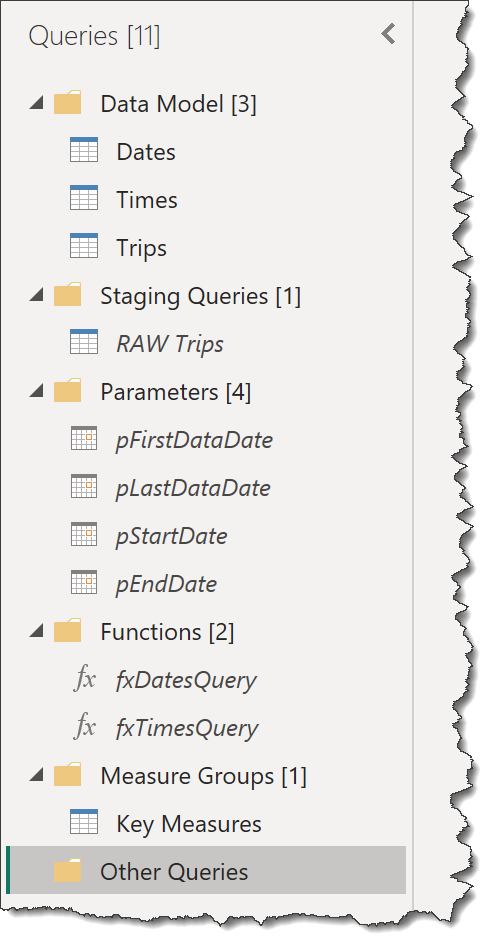
  • • a screenshot of the queries pane of the [Power Query Editor] with all groups expanded
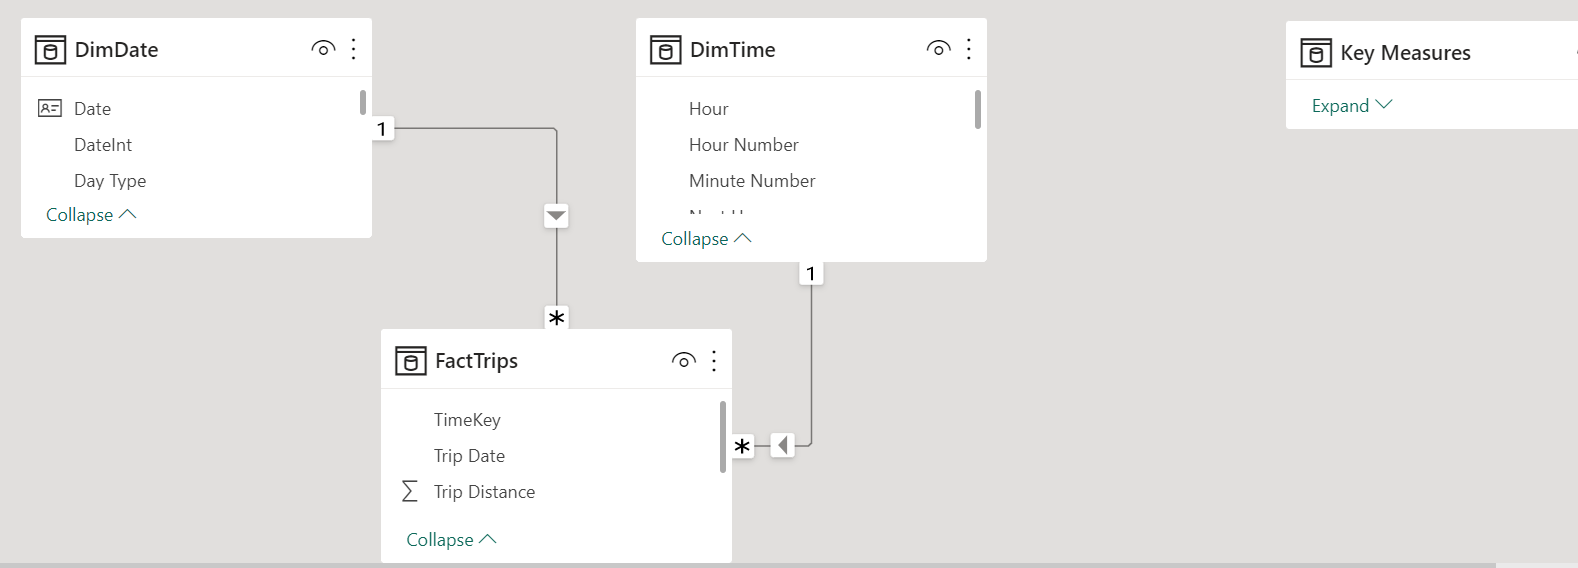
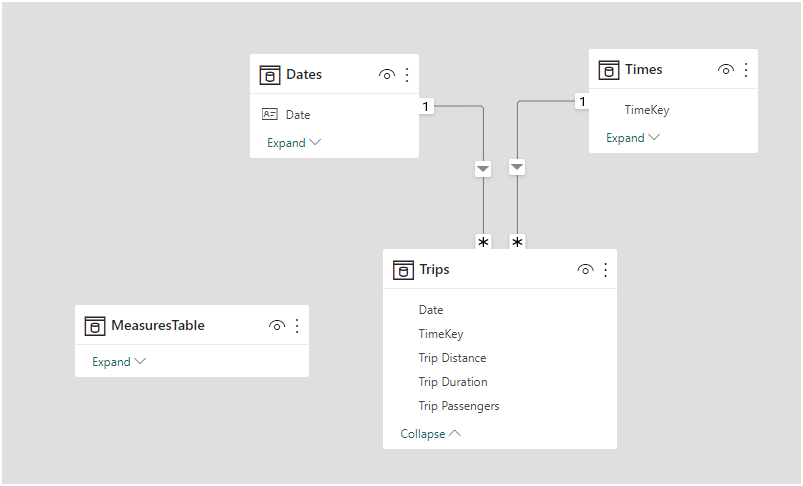
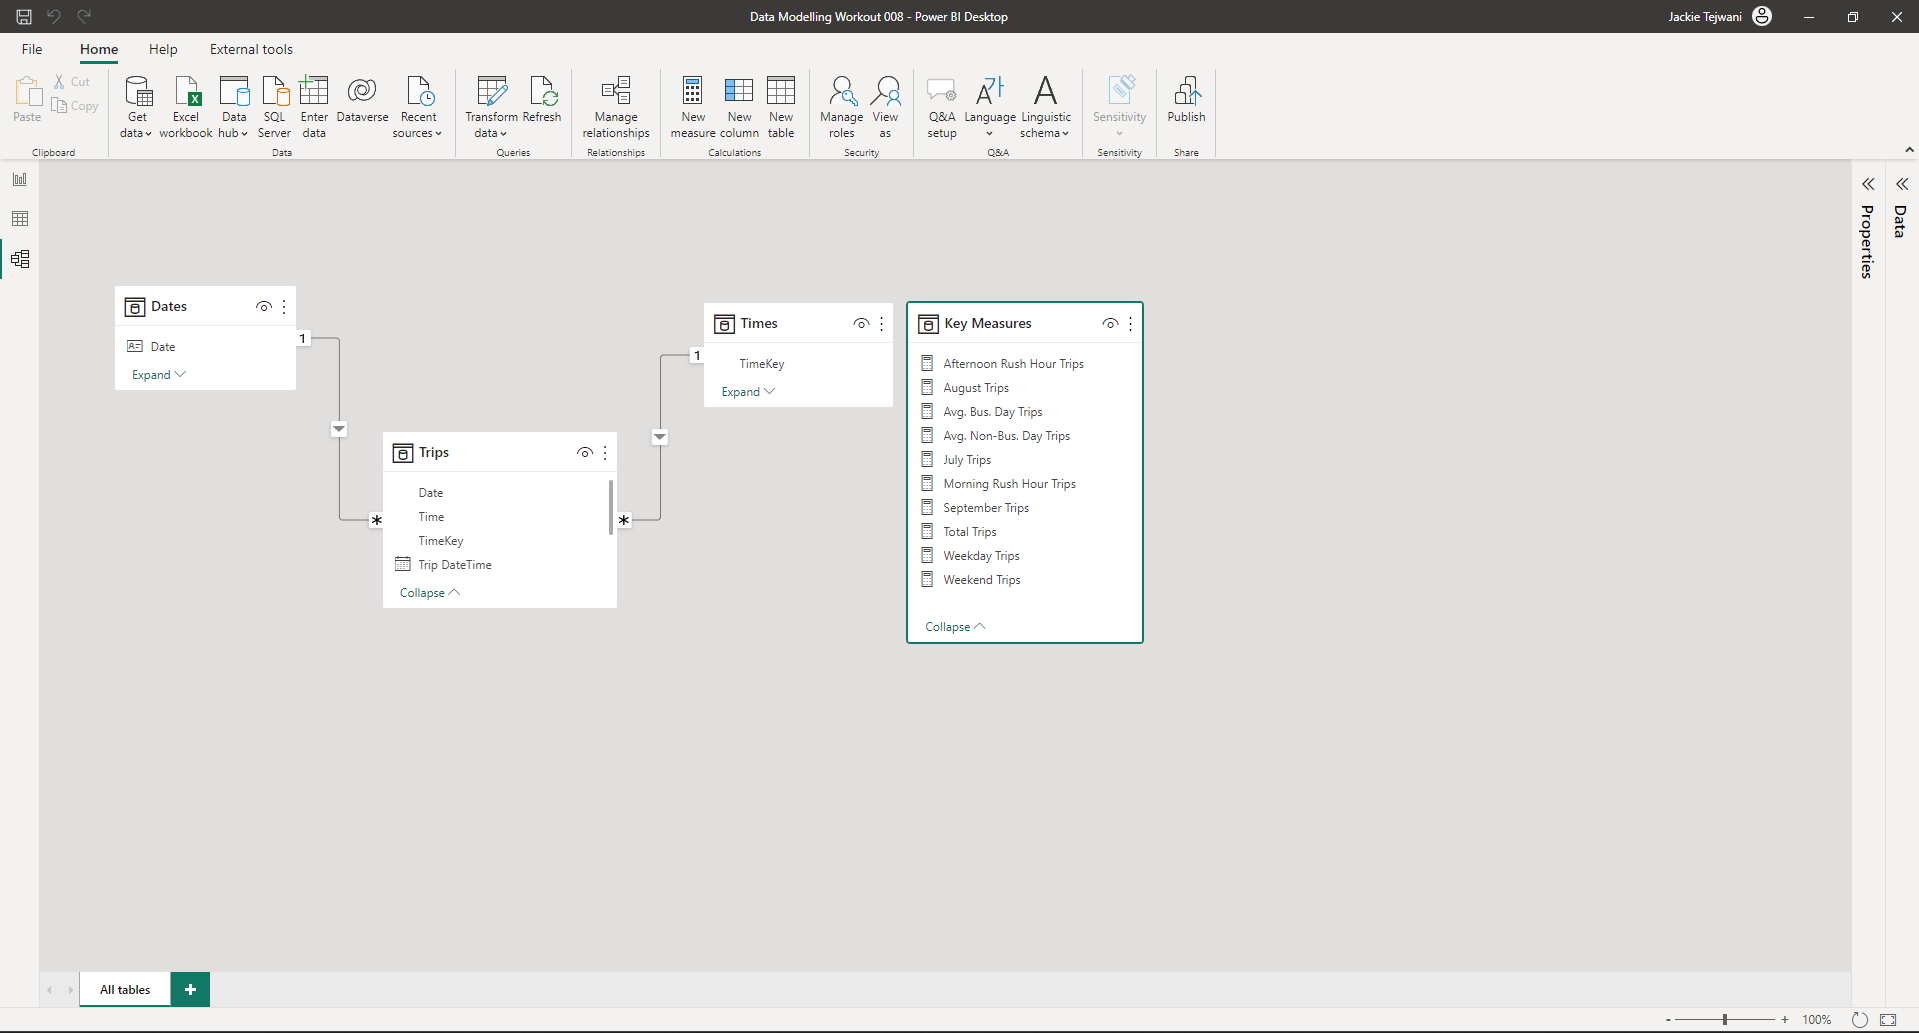
  • • a screenshot of the data model as displayed in the [Model View]
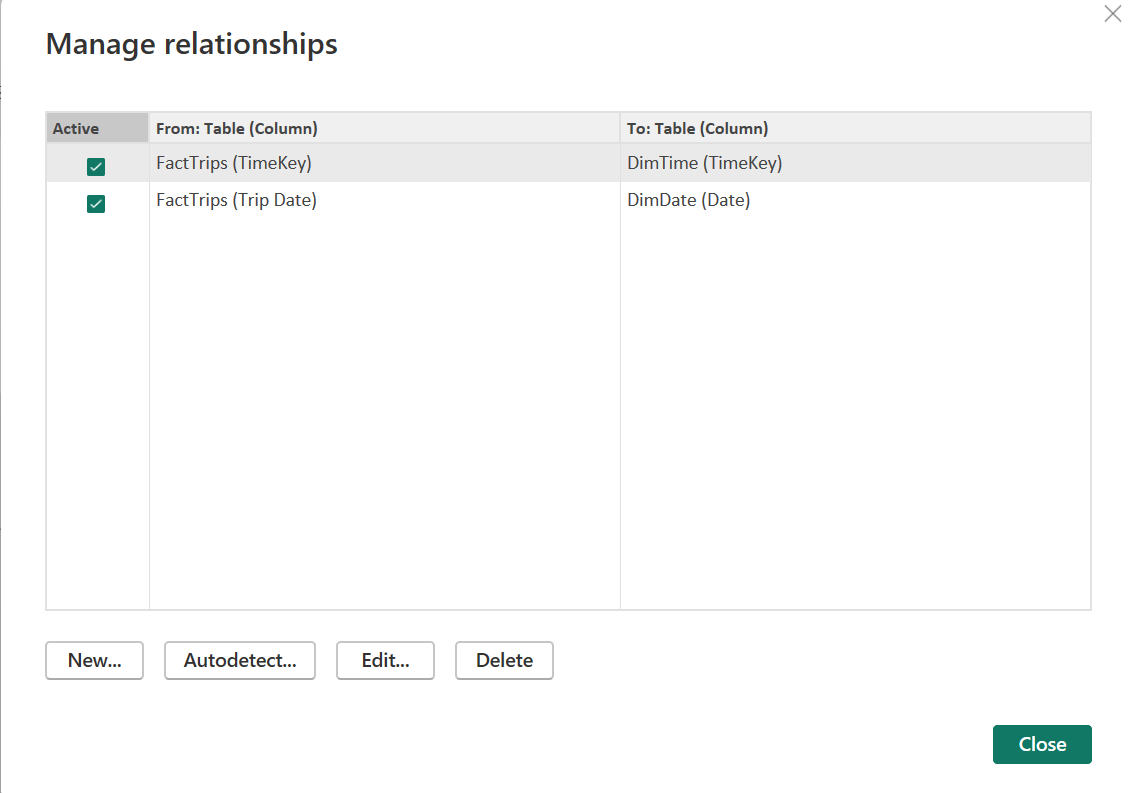
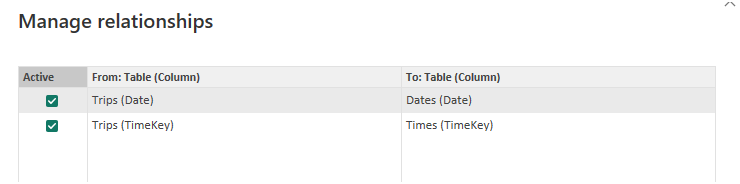
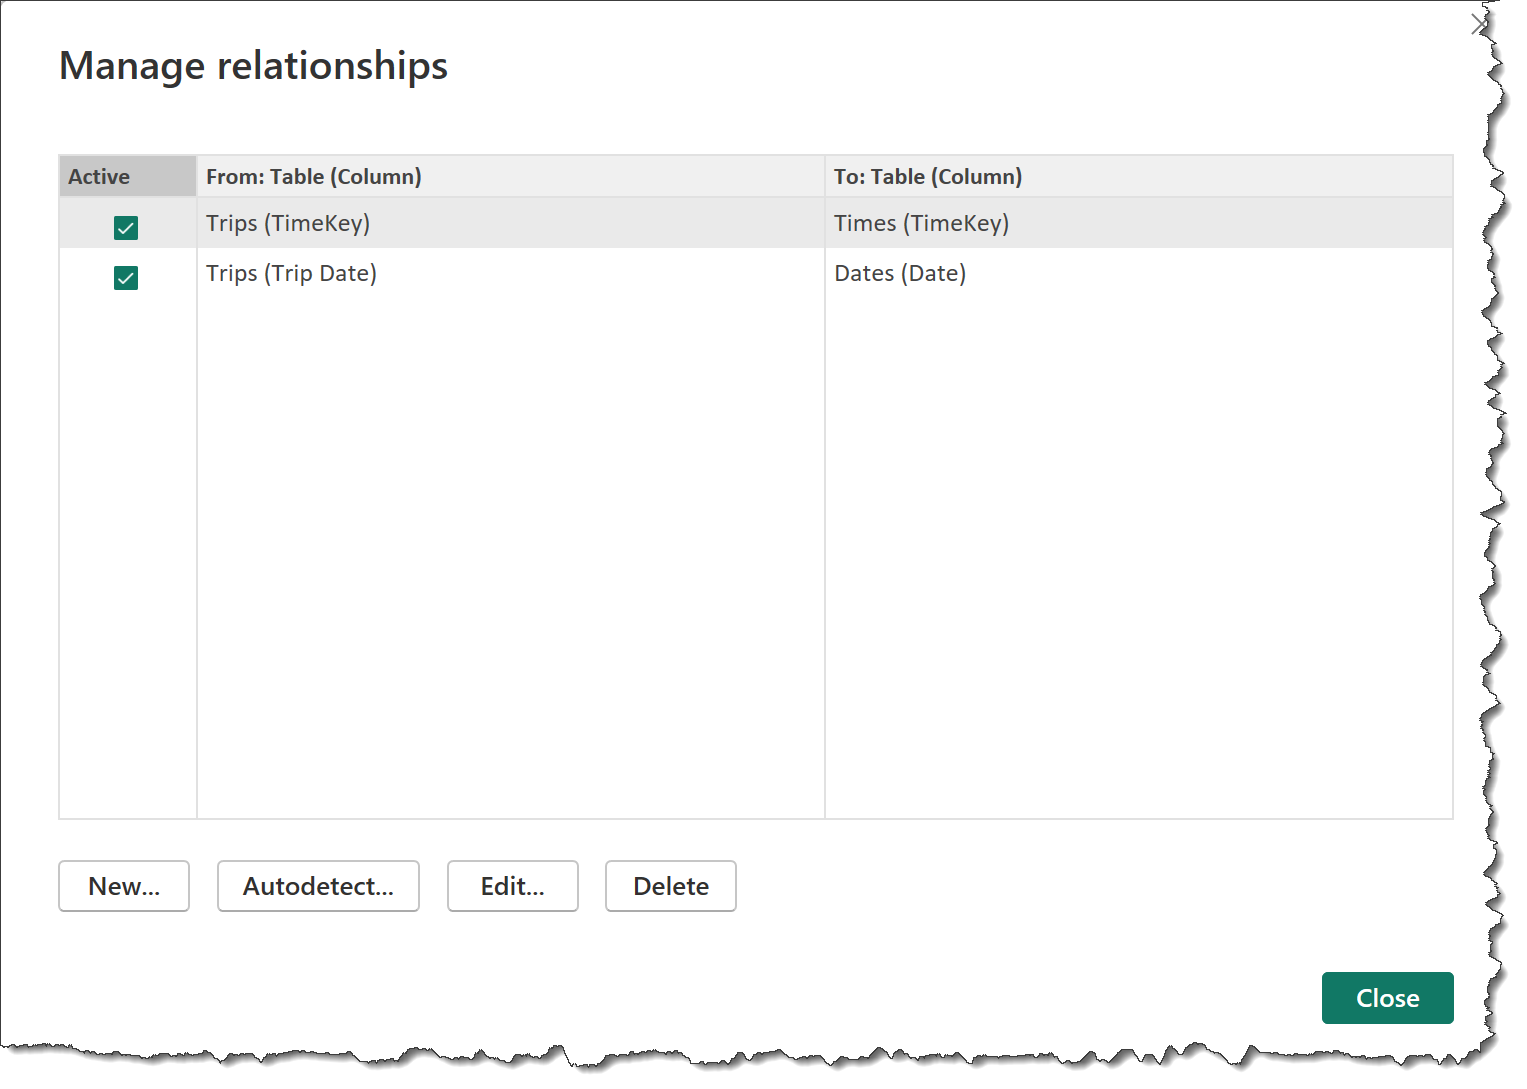
  • • a screenshot of the [Manage Relationships] dialog
  • • an animated GIF of your Power BI file “in action” (i.e., while making slicer selections)
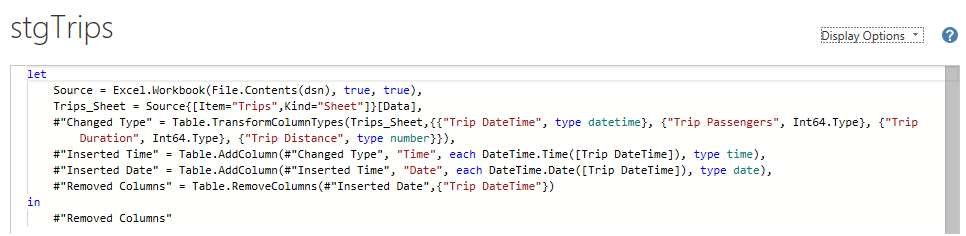
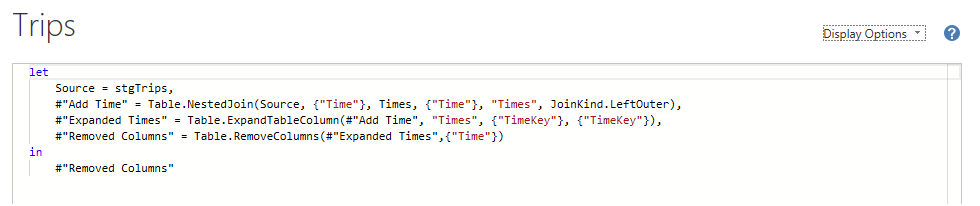
  • • the M code for the [Trips] table

Please blur your screenshots and GIFs or place them in a hidden section.

(While this workout builds upon the skills inherent in previous workouts, it is recommended that respondents do not use existing Power BI files as starting points, but rather start a new file from scratch. While this may involve some repetition, that is actually the point, as it serves to reinforce the tasks/activities inherent in a good data model; practice makes …)

Period
This workout will be released on Monday May 29, 2023, and the author’s solution will be posted on Sunday June 11, 2023.

Edit 2023-06-04: the “active” period for this workout has been extended to 2 weeks and the solution posting date has been revised accordingly..

Greg
Data Modelling Workout 08 - Data - NYC Taxi Sample.xlsx (22.1 MB)
Data Modelling Workout 08 - DAX Measures.txt (1.5 KB)

eDNA Forum - Extended Dates Table:

eDNA Forum - Times Table:

2 Likes

Here is my submission for this workout. Thanks @Greg for the opportunity.

Manage Relationship

Summary

Power Query

Summary

Modal View

Summary

Report

Summary

workout008_Eze

@Greg,

Thank you for planning this.

Query Pane

img-query-pane

M code for the fact table:

Advanced Editor: Trips

Two shots of the Trips modeling:

stgTrips

and

Trips

An image of the data model:

Data Model

The manage relationships screen:

Manage Relationships

And, finally, the report in action:

in-action

Another great workout @BrianJ and @Greg. Please see my submission below

Power Query

Data Model

Visualization

Here’s the notes I kept during the development of my solution to this workout.

Pre-Modelling Activities - General/Options:

  • • create new, empty PBIX
  • • use File\Options\Options and settings\Global\Data Load\Time intelligence to ensure Auto Date/time for new files is disabled
  • • use File\Options\Options and settings\Current File\Data Load\Time intelligence to ensure Auto Date/time is disabled
  • • use File\Options\Options and settings\Current File\Data Load\Relationships to ensure Autodetect new relationships after data is loaded is disabled
  • • use File\Options\Options and settings\Current File\Data Load\Relationships to ensure Import relationships from data sources on first load is disabled
  • • use [Enter data] to create an empty [Key Measures] table; create a placeholder measure (say, m1 = 1); right-click on [Column1] and select [Hide]

Pre-Modelling Activities - Dates Table:

  • • copy the M code for latest version of Extended Date Table from Enterprise DNA (from Extended Date Table (Power Query M function))
  • • use Query Editor in Power BI Desktop to do the following:
  • • create a new blank query, paste the M code (as copied above), rename the blank query to [fxDatesQuery]
  • • move [fxDatesQuery] into a new group [Functions]
  • • create a new blank query for a parameter to hold the earliest fact table data date (use placeholder date of, say, 2020-01-01); rename the blank query to [pStartDataDate]
  • • create a new blank query for a parameter to hold the latest fact table data date (use placeholder date of, say, 2020-12-31); rename the blank query to [pEndDataDate]
  • • create a new blank query for a parameter to hold January 1st of the year of the earliest fact table data date; rename the blank query to [pStartDate]
  • • create a new blank query for a parameter to hold December 31st of the year of the latest fact table data date (add 1 year to ensure DAX code that uses time intelligence functions operates properly); rename the blank query to [pEndDate]
  • • move the [pStartDataDate], [pEndDataDate], [pStartDate], and [pEndDate] parameters into a new group [Parameters]
  • • modify the code of the [fxDatesQuery] function to use the [pStartDate] and [pEndDate] parameters

Pre-Modelling Activities - Times Table:

  • • copy the M code for latest version of Time Table (Power Query M function) from Enterprise DNA (from Time Table (Power Query M function))
  • • use Query Editor in Power BI Desktop to do the following:
  • • create a new blank query, paste the M code (as copied above), rename the blank query to [fxTimesQuery]
  • • move [fxTimesQuery] into a new group [Functions]

Pre-Modelling Activities - Data Loading:

  • • load raw sales data from [Trips] tab of the Data Excel file; rename query to [RAW Trips]; deselect “Enable Load”; move into a new group [Staging Queries]
  • • create reference of [RAW Trips]; rename as [Trips]; move into a new group [Data Model]
  • • create duplicate of [Trip DateTime] column; select the original and use “Transform\Date\Date Only” to keep only the date portion; rename to [Trip Date]; select the duplicate and use “Transform\Time\Time Only” to keep only the time portion; rename to [Trip Time]
  • • create a text column [Time Key] in the [Trips] table from the [Trip Time] column using “HHmm” format
  • • modify the placeholder dates in the [pStartDate] and [pEndDate] parameters to use the earliest and latest [Trip Date] of the [Trips] table
  • • use the [fxDatesQuery] function to create a new table; rename the resultant table to [Dates];
  • • move the [Dates] table into the [Data Model] group
  • • mark [Dates] table as a date table
  • • use the [fxTimesQuery] function to create a new table; rename the resultant table to [Times];
  • • move the [Times] table into the [Data Model] group

Modelling Activities - Model View:

  • • delete any relationships that may already exist (i.e., were automatically created by Power BI)
  • • rearrange tables into waterfall layout, so that dimension (lookup) tables are in the top row, fact tables are in the bottom row, and measure tables are in columns at the right (so [Dates] and [Times] on top, [Trips] below, and [Key Measures] at right)
  • • use [Manage Relationships] to add (1-to many) relationships for:
    • • Dates[Date] → Trips[Trip Date]
    • • Times[Time Key] → Trips[Time Key]


Post-Modelling Activities - Measures:

  • • create a new measure in the [Key Measures] table for each entry in the DAX Measures text file

Post-Modelling Activities - Visualizations:

  • • create slicers for Dates[Month Name], Dates[Day Type], Times[Period of Day], Dates[Day of Week Name], and Dates[Date] columns
  • • create a matrix with Time[Hour Number] on rows (renamed to [Hours]), Dates[Day of Week Name] on rows, and [Total Trips] measure on values
  • • use conditional formatting on the values for background colour (gradient, values only, minimum = 1, maximum = 8000)
  • • create a multi-row card for dynamic measures
  • • create a multi-row card for static measures

Congratulations to all who participated, and good luck.
Greg
Data Modelling Workout 08 - Times Table.pbix (5.2 MB)

1 Like