Estimated difficulty level:
3.5 out of 5
INTRO
This workout is a continuation of our series on effectively addressing many-to-many relationships in your Power BI data models.
Originally, @Greg and I had envisioned this as a three-part series. However, we decided to add this additional week’s workout to the series to give you additional practice with this essential technique for resolving mismatched granularities across tables by reallocating amounts to finer level granularity.
OBJECTIVES AND INSTRUCTIONS
This Workout is a re-do of Workout 06, with a different set of assumptions regarding how to reallocate the monthly Sales Targets to a daily granularity.
There are only two differences from Workout 06:
-
In the attached PBIX, I have incorprated a holiday table into the Enterprise DNA Dates table used within the model.
-
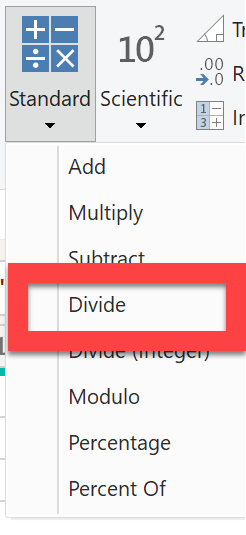
More critically, in Workout 006 we assumed that daily sales were roughly similar and thus we could allocate the monthly target to daily by dividing it by the number of days in each month.
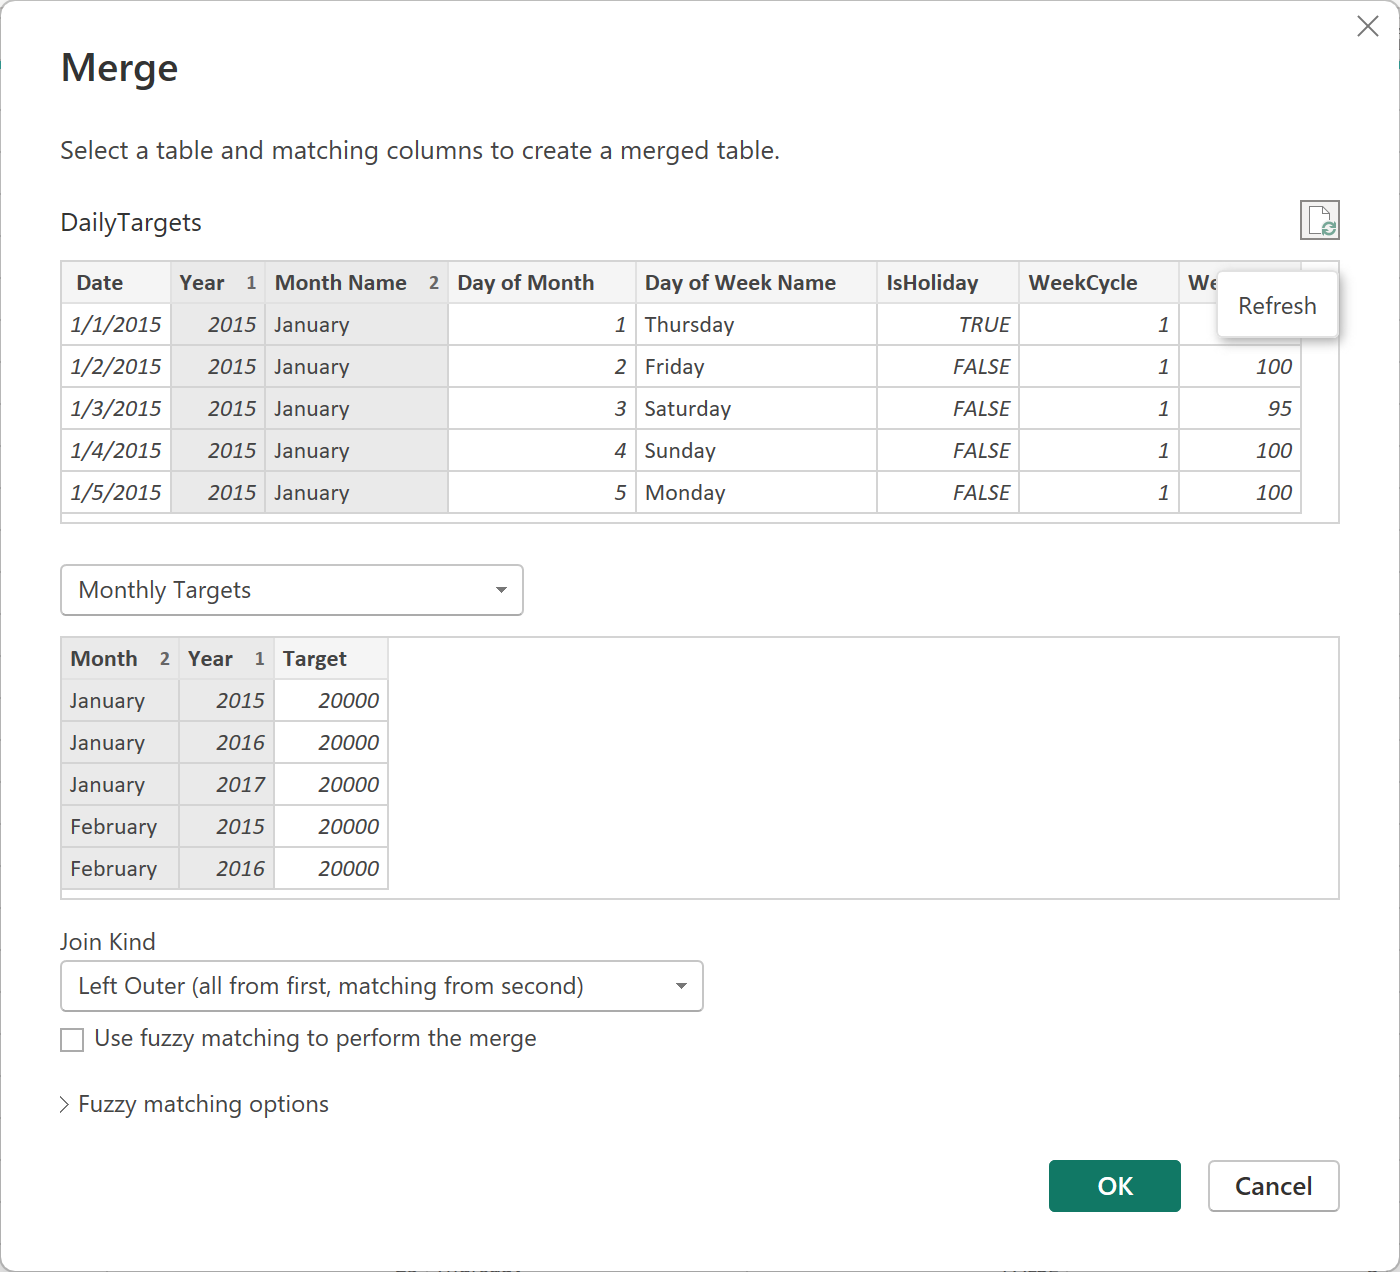
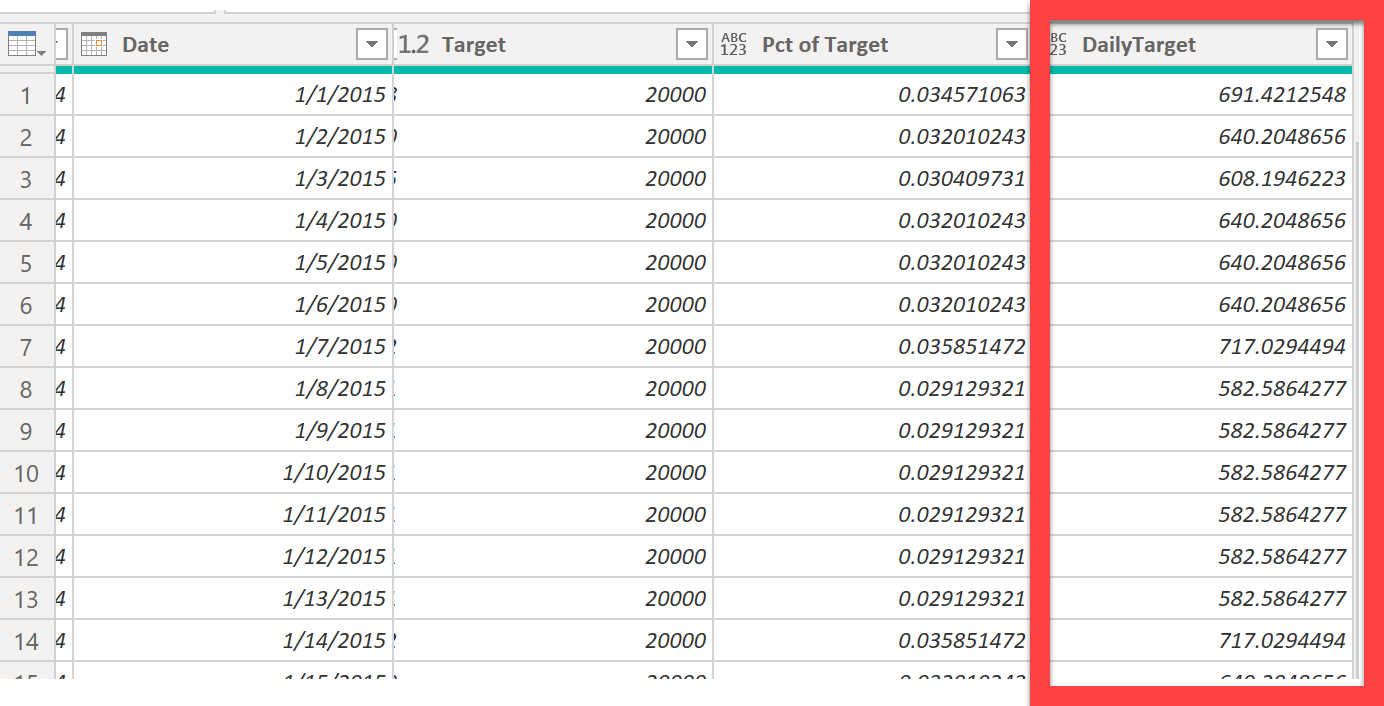
The goal of this workout is to fix the granularity mismatch between the Dates table and the Monthly Sales Targets table by allocating those targets down to the daily level.
But this time, instead of assuming a constant target for each year and month, we will perform our allocation of the monthly targets based on a more complex and realistic ruleset from our Sales Forecasting Team.
They have analyzed 10 years of historic sales data and have come up with the following findings regarding the attributes associated with days that have significantly higher (or lower) total sales.
Here is a summary of their findings:
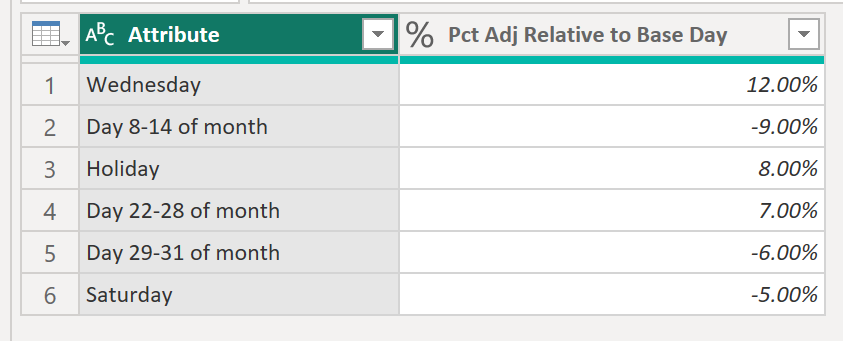
What this means is that a Wednesday is expected to have 12.0% higher sales than a non-Wednesday and thus the monthly sales target on Wednesdays should be 12% higher than “normal” days.
A few guidelines in applying this table in your allocation:
![]() A given day only gets a single adjustment, and the priority is determined by the absolute value of the % adjustment in descending order (the list is already sorted this way). So, for example suppose Christmas falls on a Saturday in a given year in the data. Three adjustments would be in play here:
A given day only gets a single adjustment, and the priority is determined by the absolute value of the % adjustment in descending order (the list is already sorted this way). So, for example suppose Christmas falls on a Saturday in a given year in the data. Three adjustments would be in play here:
- Holiday
- Day 22-28 of the month
- Saturday
In this case you would apply the Holiday adjustment (+8%) since that’s the highest “ranked” adjustment with the greatest magnitude impact.
Here’s another example: A holiday that falls on Thursday Nov. 11. In this case, only two adjustments would be in play:
- Holiday
- Day 8-14 of the month
In THIS case, you would apply an adjustment of -9%, since the Day 8-14 adjustment is higher “ranked” given that absolute magnitude of the impact is greater (9% vs. 8%)
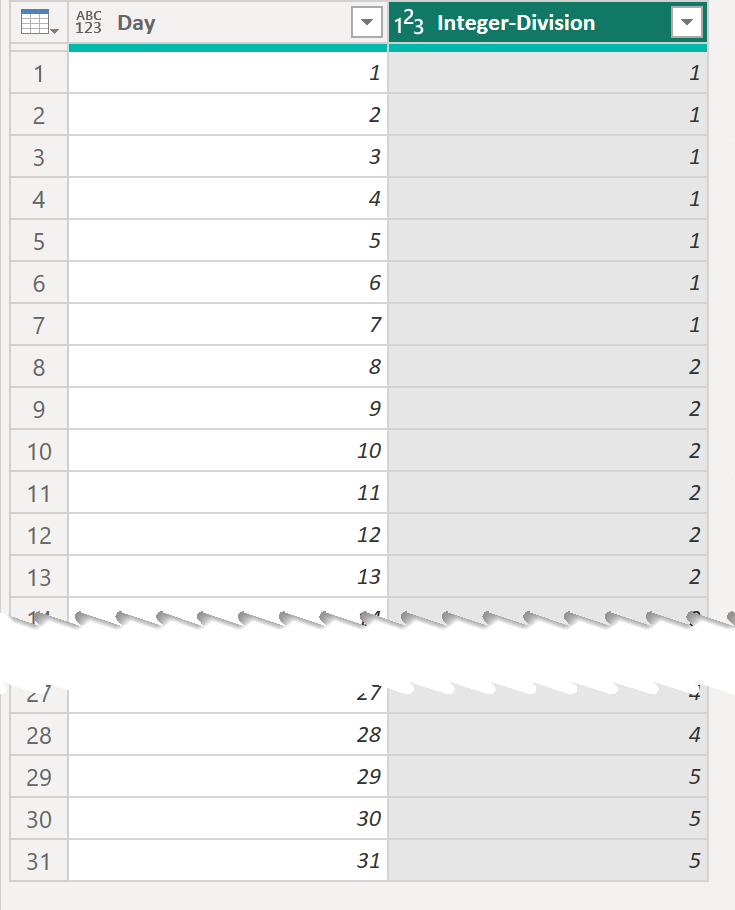
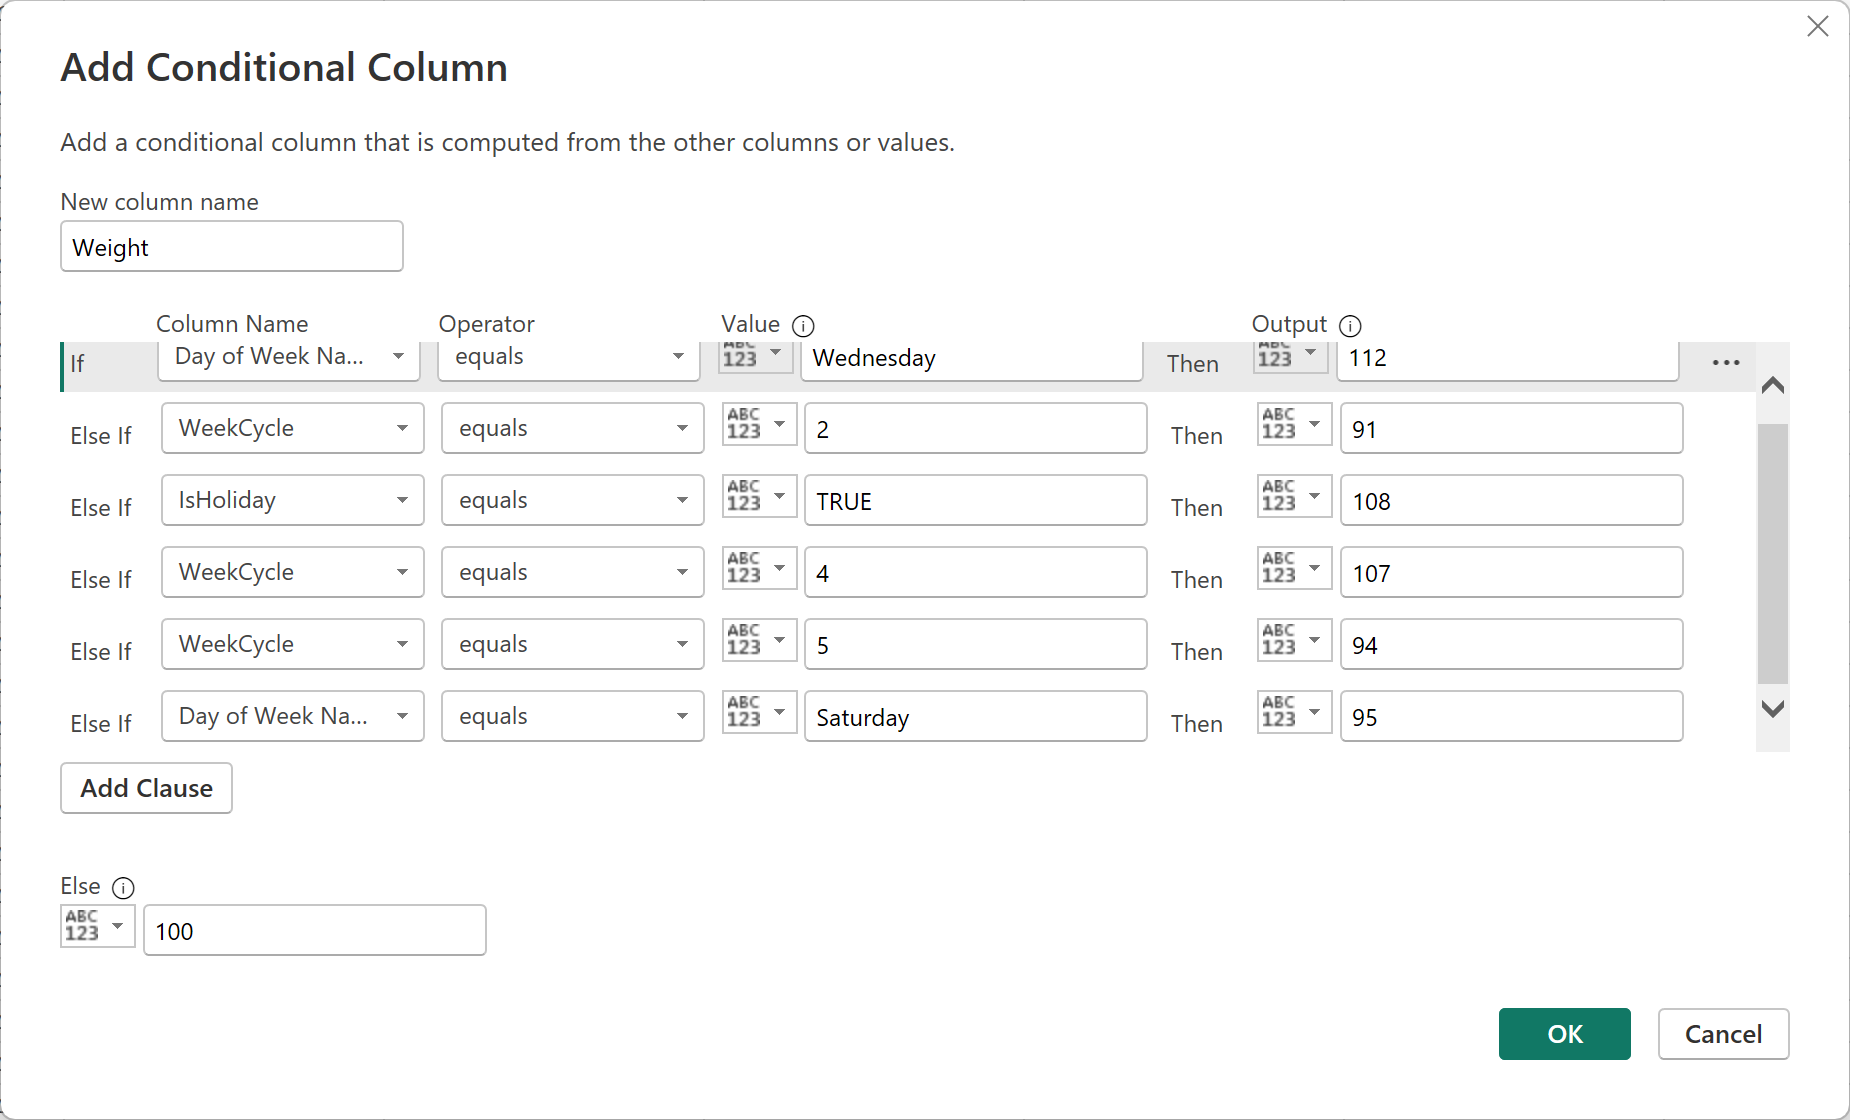
![]() HINT - In these sorts of allocation exercises, I find it helpful to assign the “base” day (i.e., a day that meets none of the adjustment conditions) 100 points, and then adjust those points up or down each day based on the adjustments table rules.
HINT - In these sorts of allocation exercises, I find it helpful to assign the “base” day (i.e., a day that meets none of the adjustment conditions) 100 points, and then adjust those points up or down each day based on the adjustments table rules.
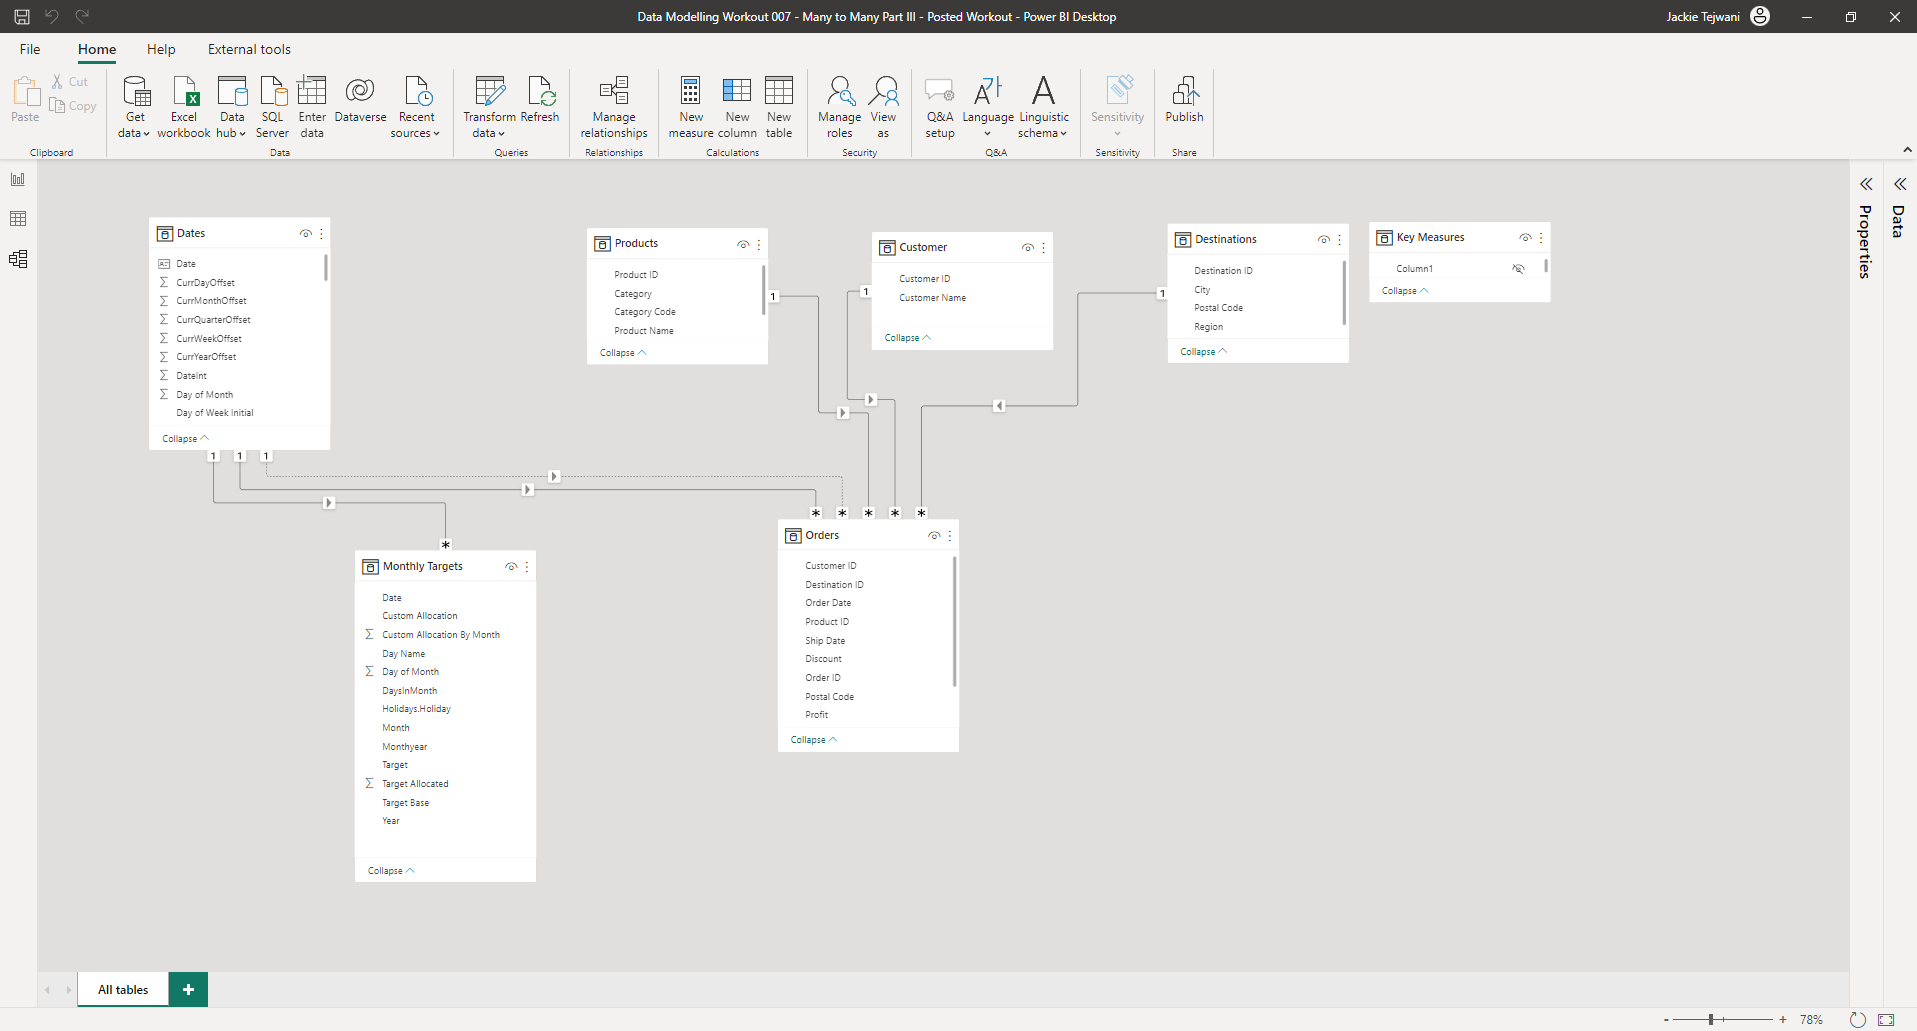
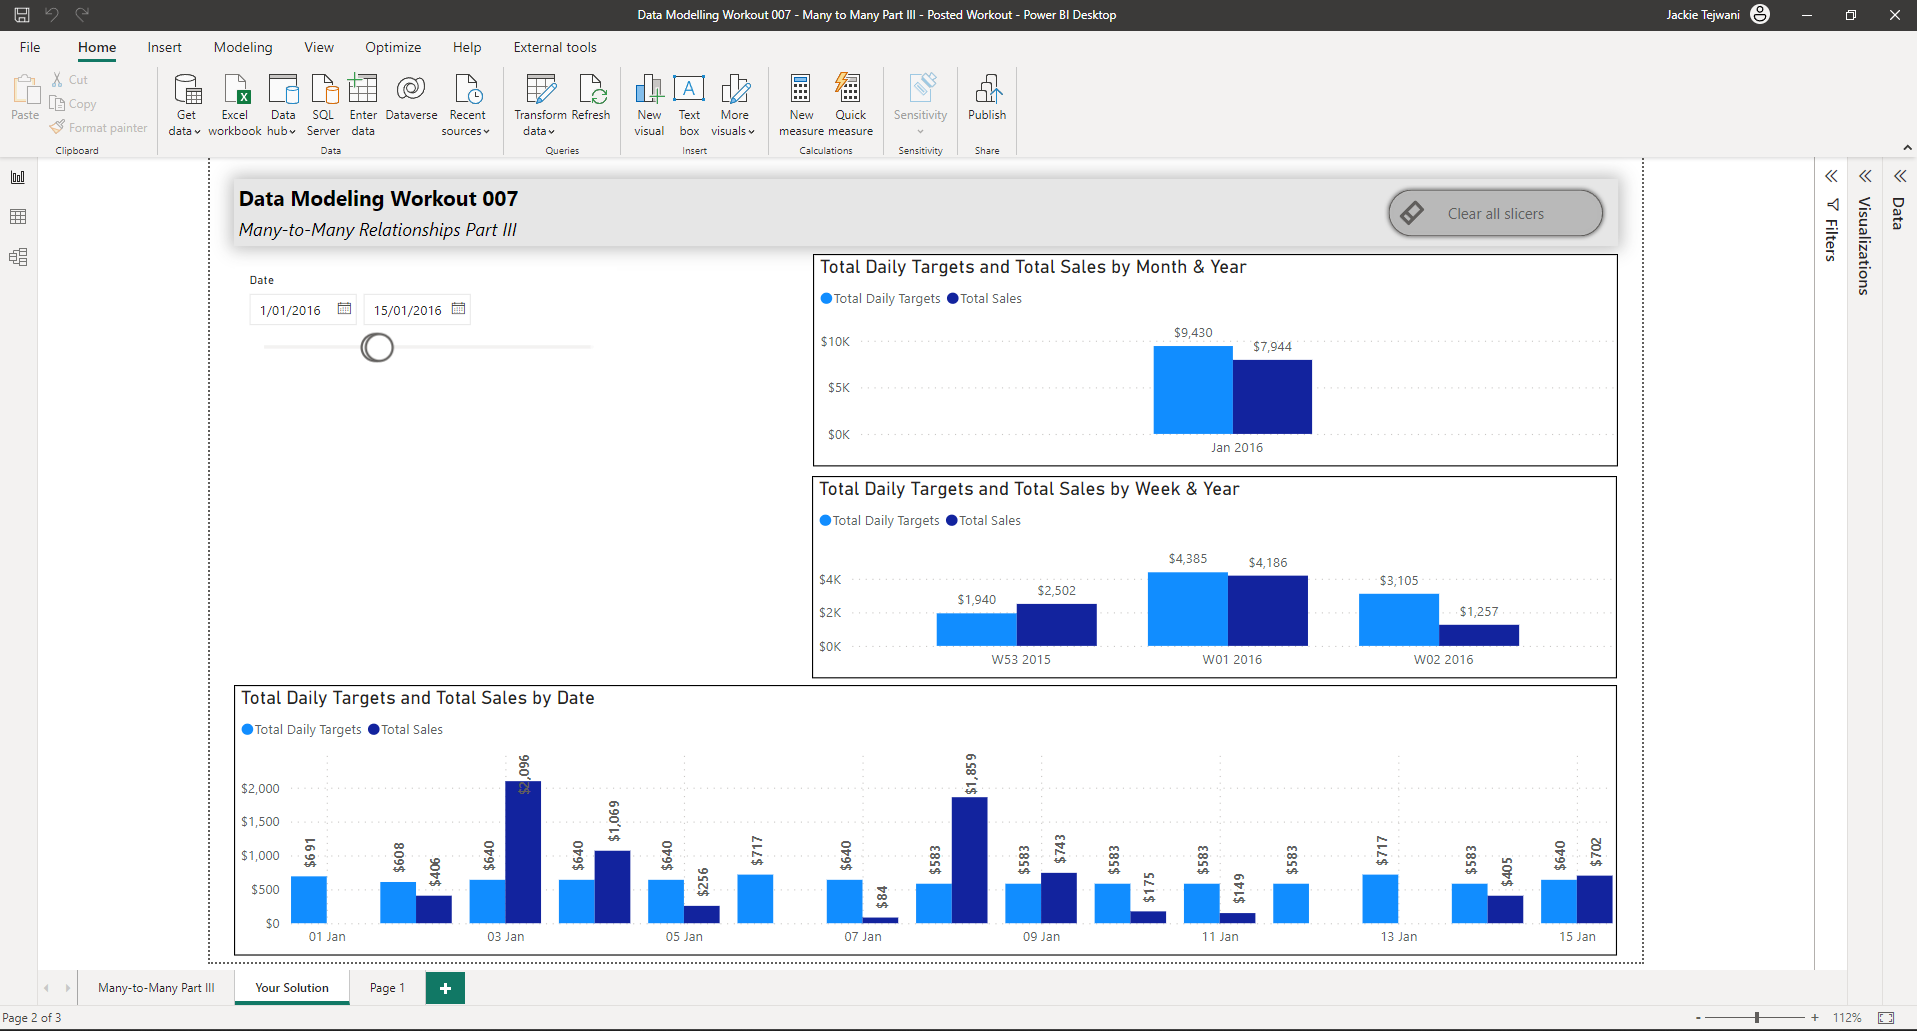
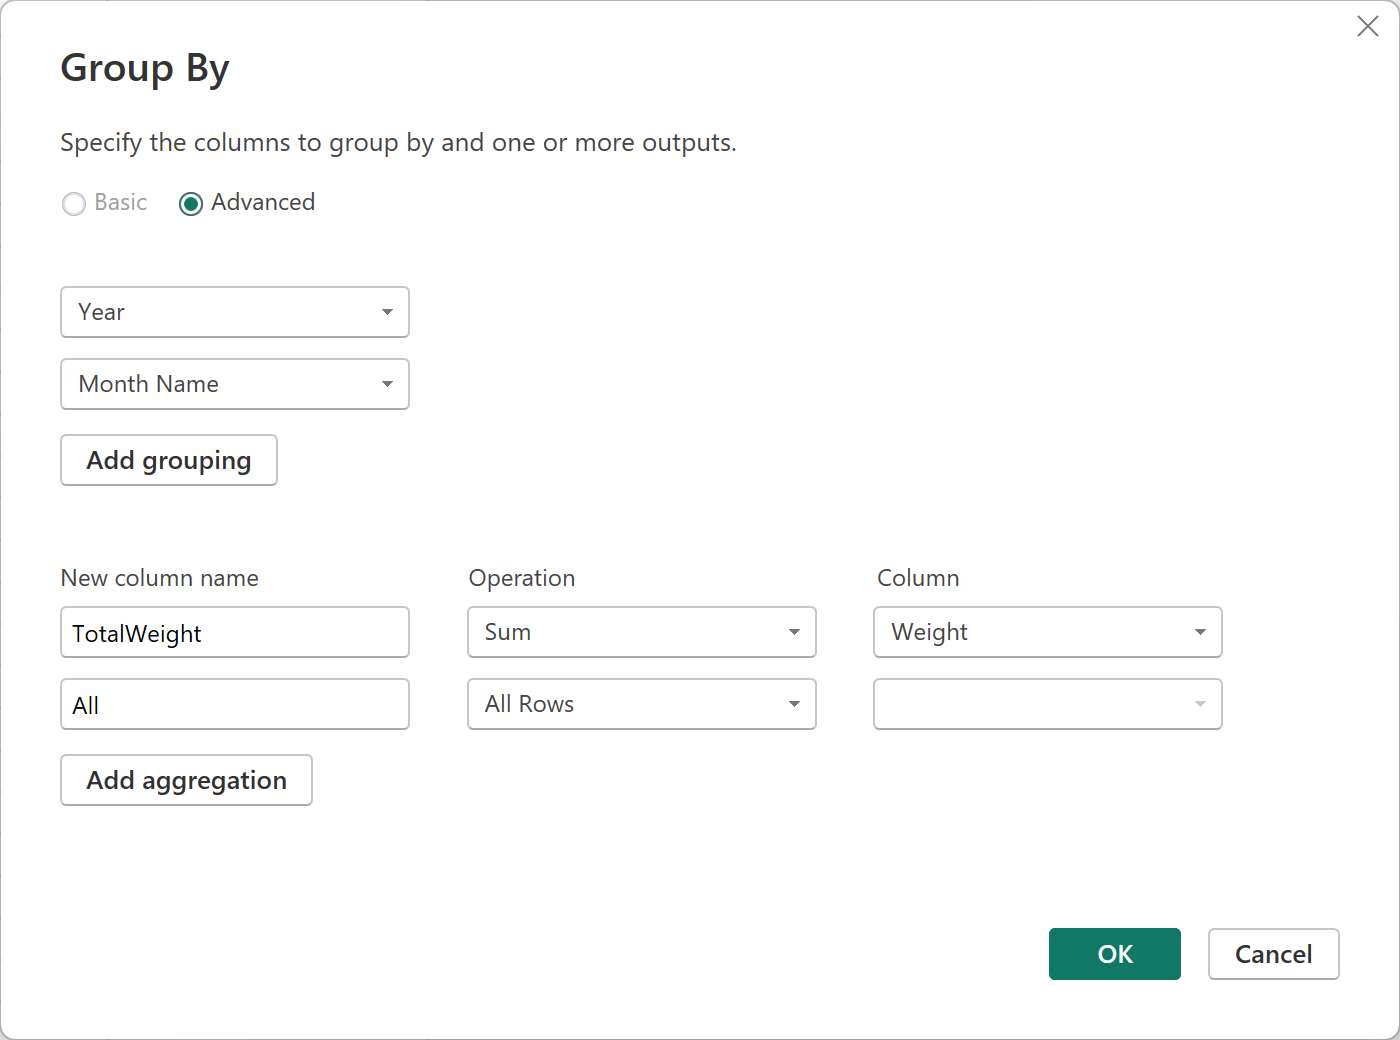
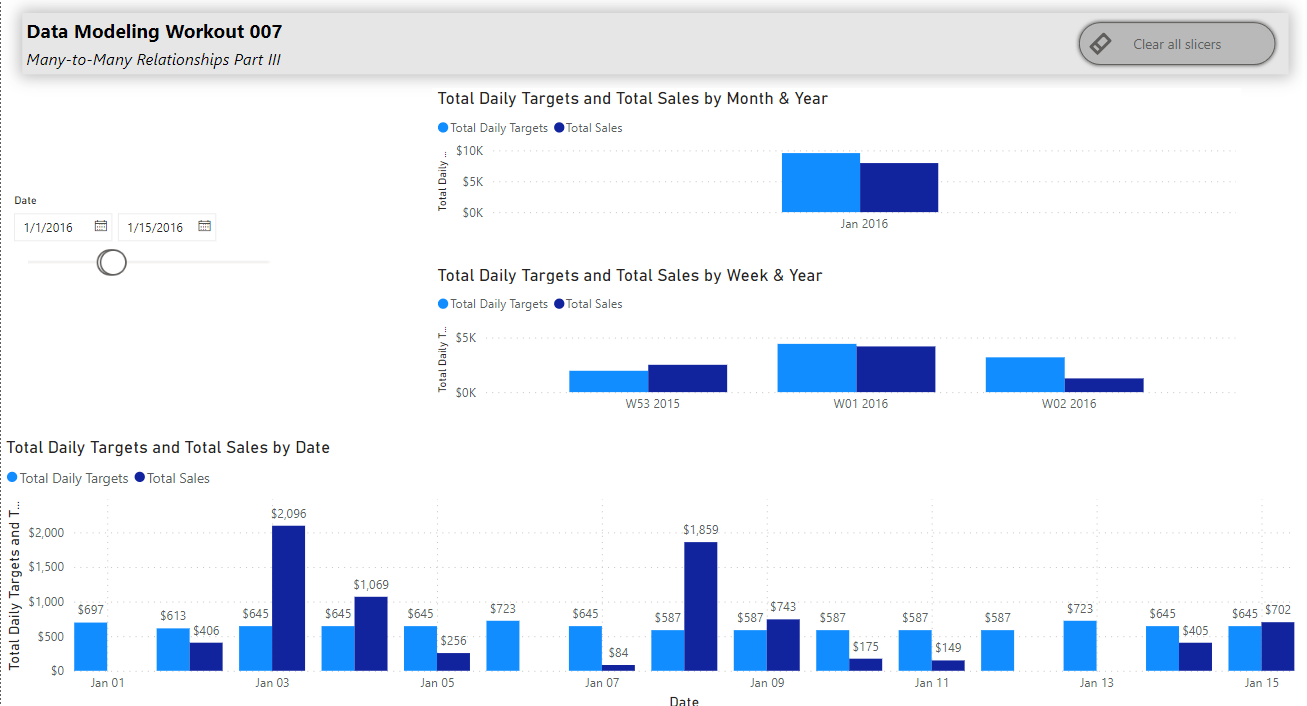
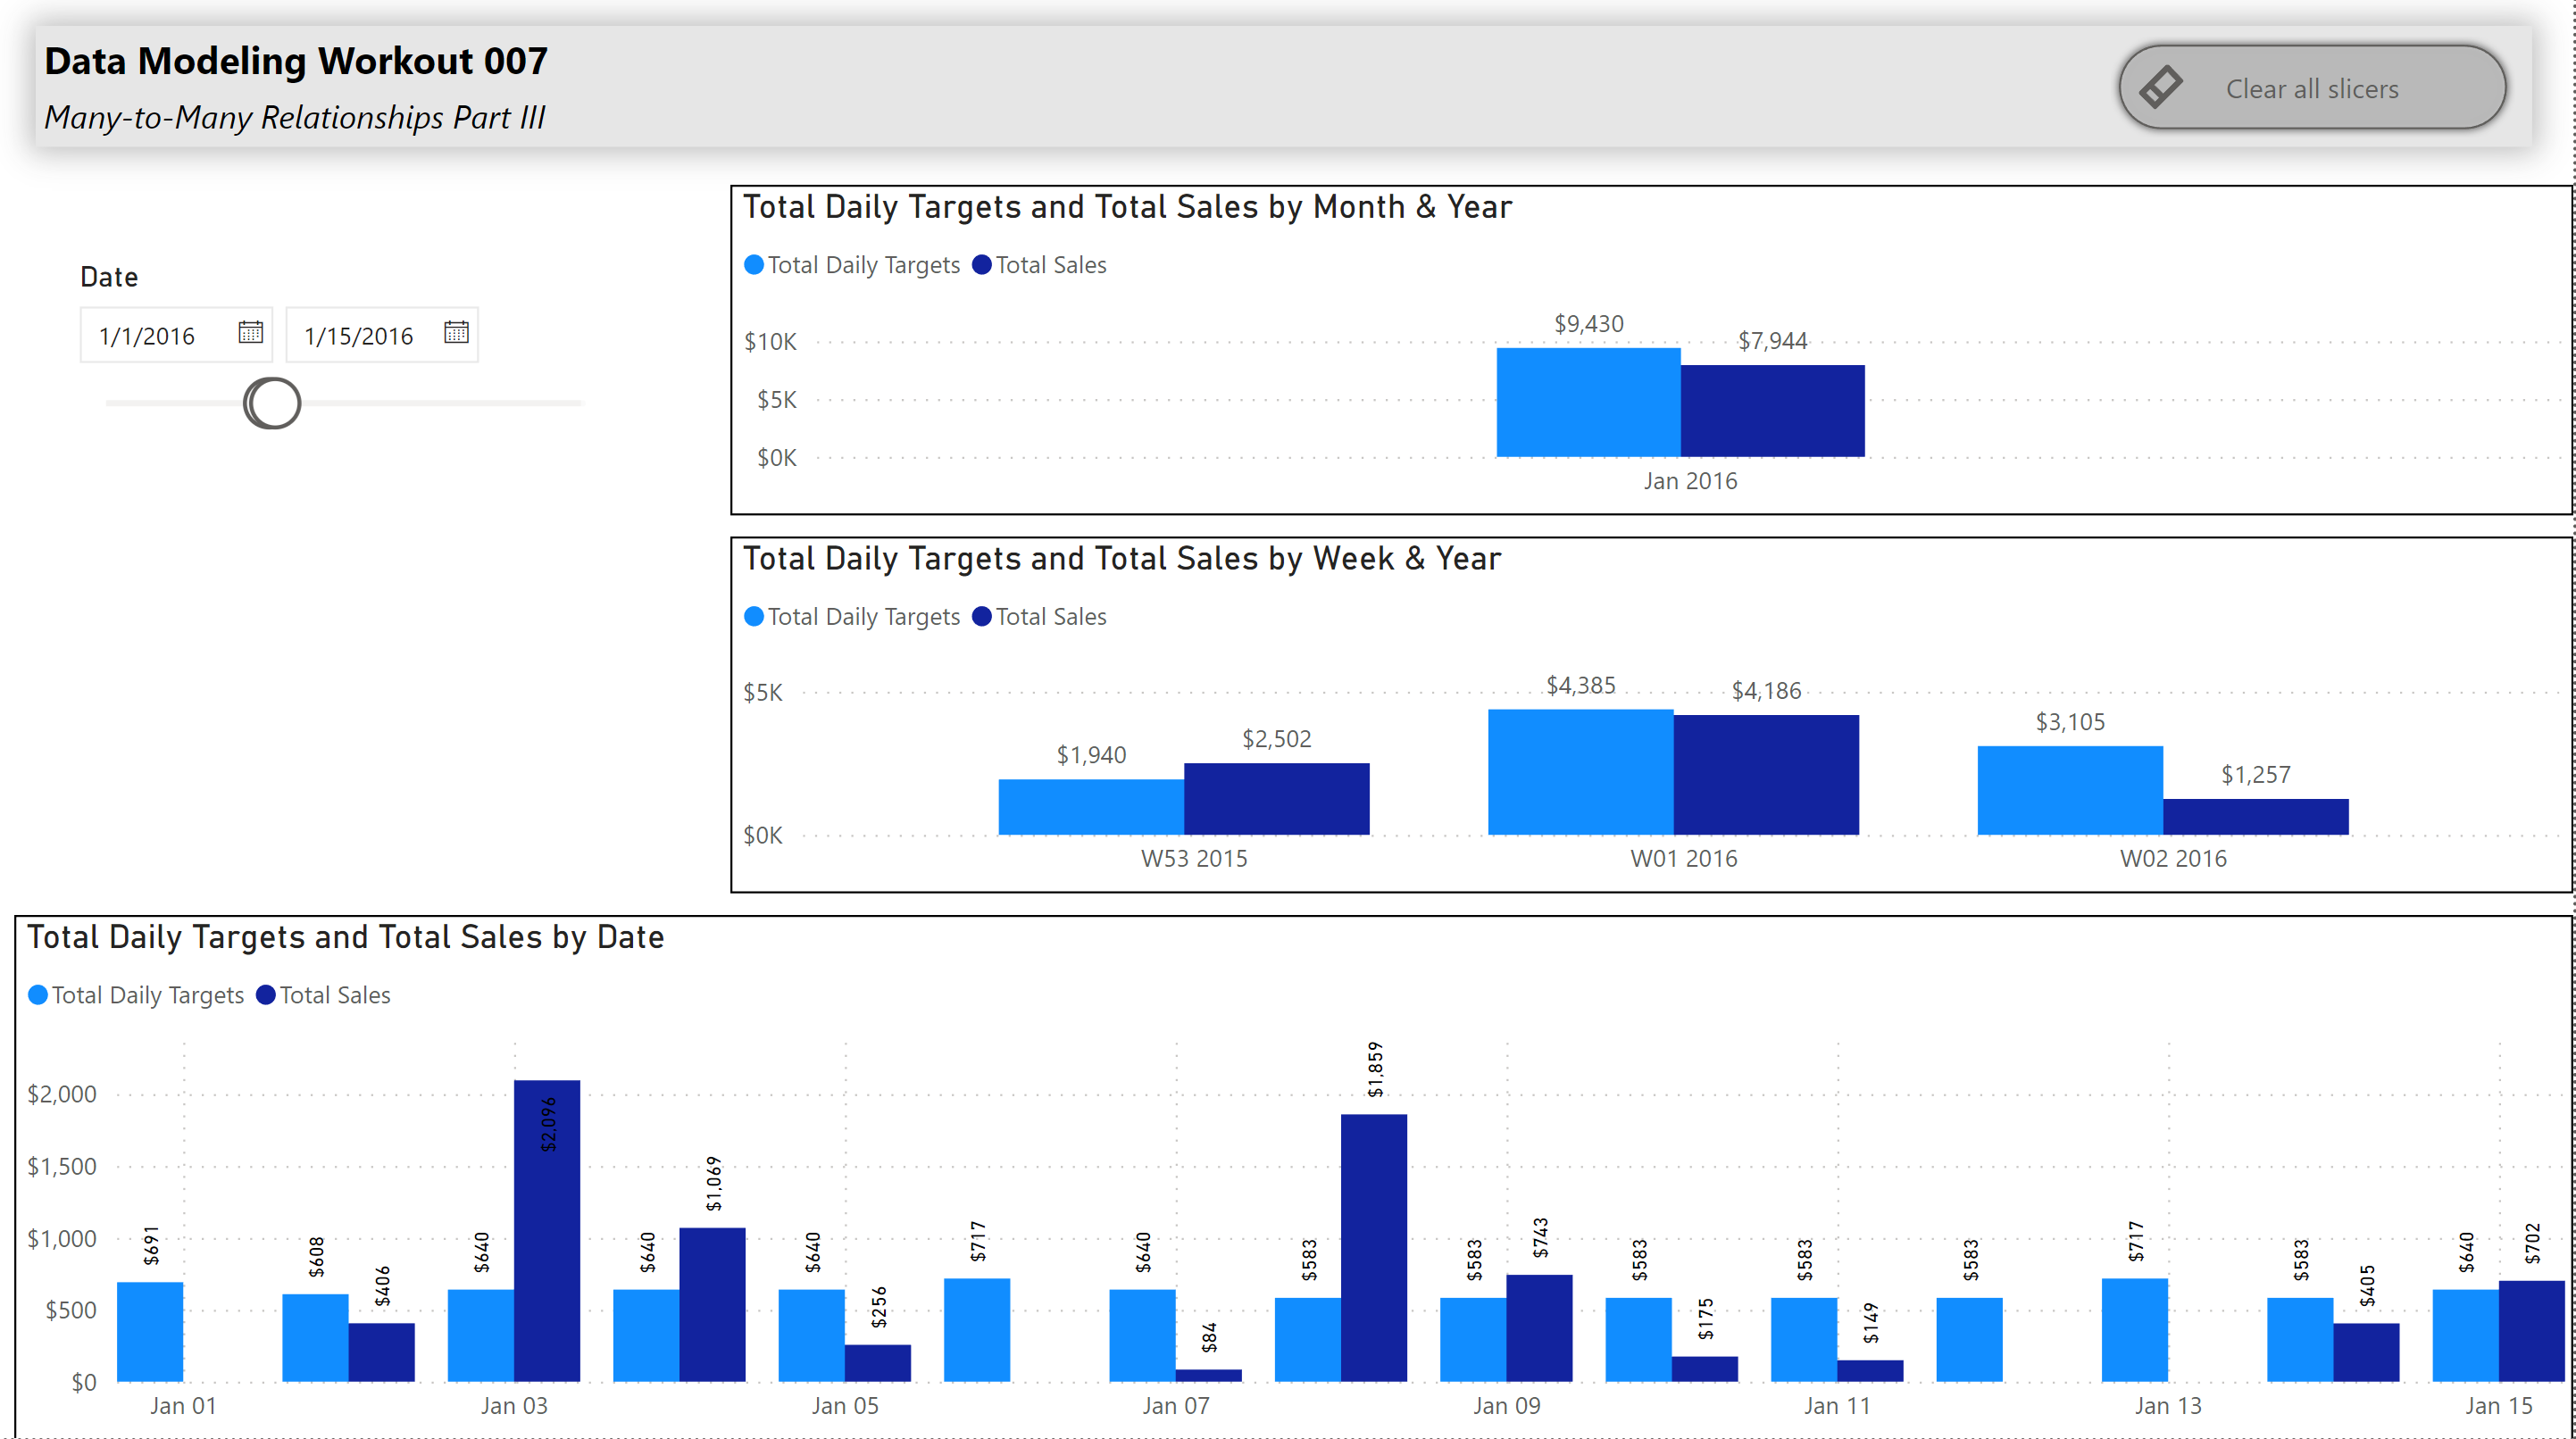
Once you have properly allocated the specified monthly sales targets to daily, connect that table to your data model (in a one-to-many unidirectional relationship) and produce the following dynamic report page that shows the actual totals sales and total sales targets at monthly, weekly and daily granularity.
NOTE: You don’t have to have completed Workout 06 to particpate in this workout, but if you haven’t we would recommend at least reviewing the problem and specified solution before tackling this one.
Good luck!
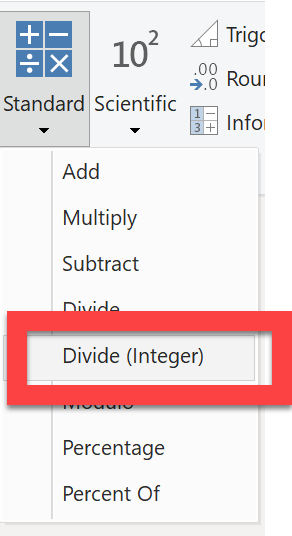
P.S. I’ve confirmed that you can do this all within the Power Query UI, but feel free to use custom M code (or even DAX, though I would recommend PQ…) if you prefer.
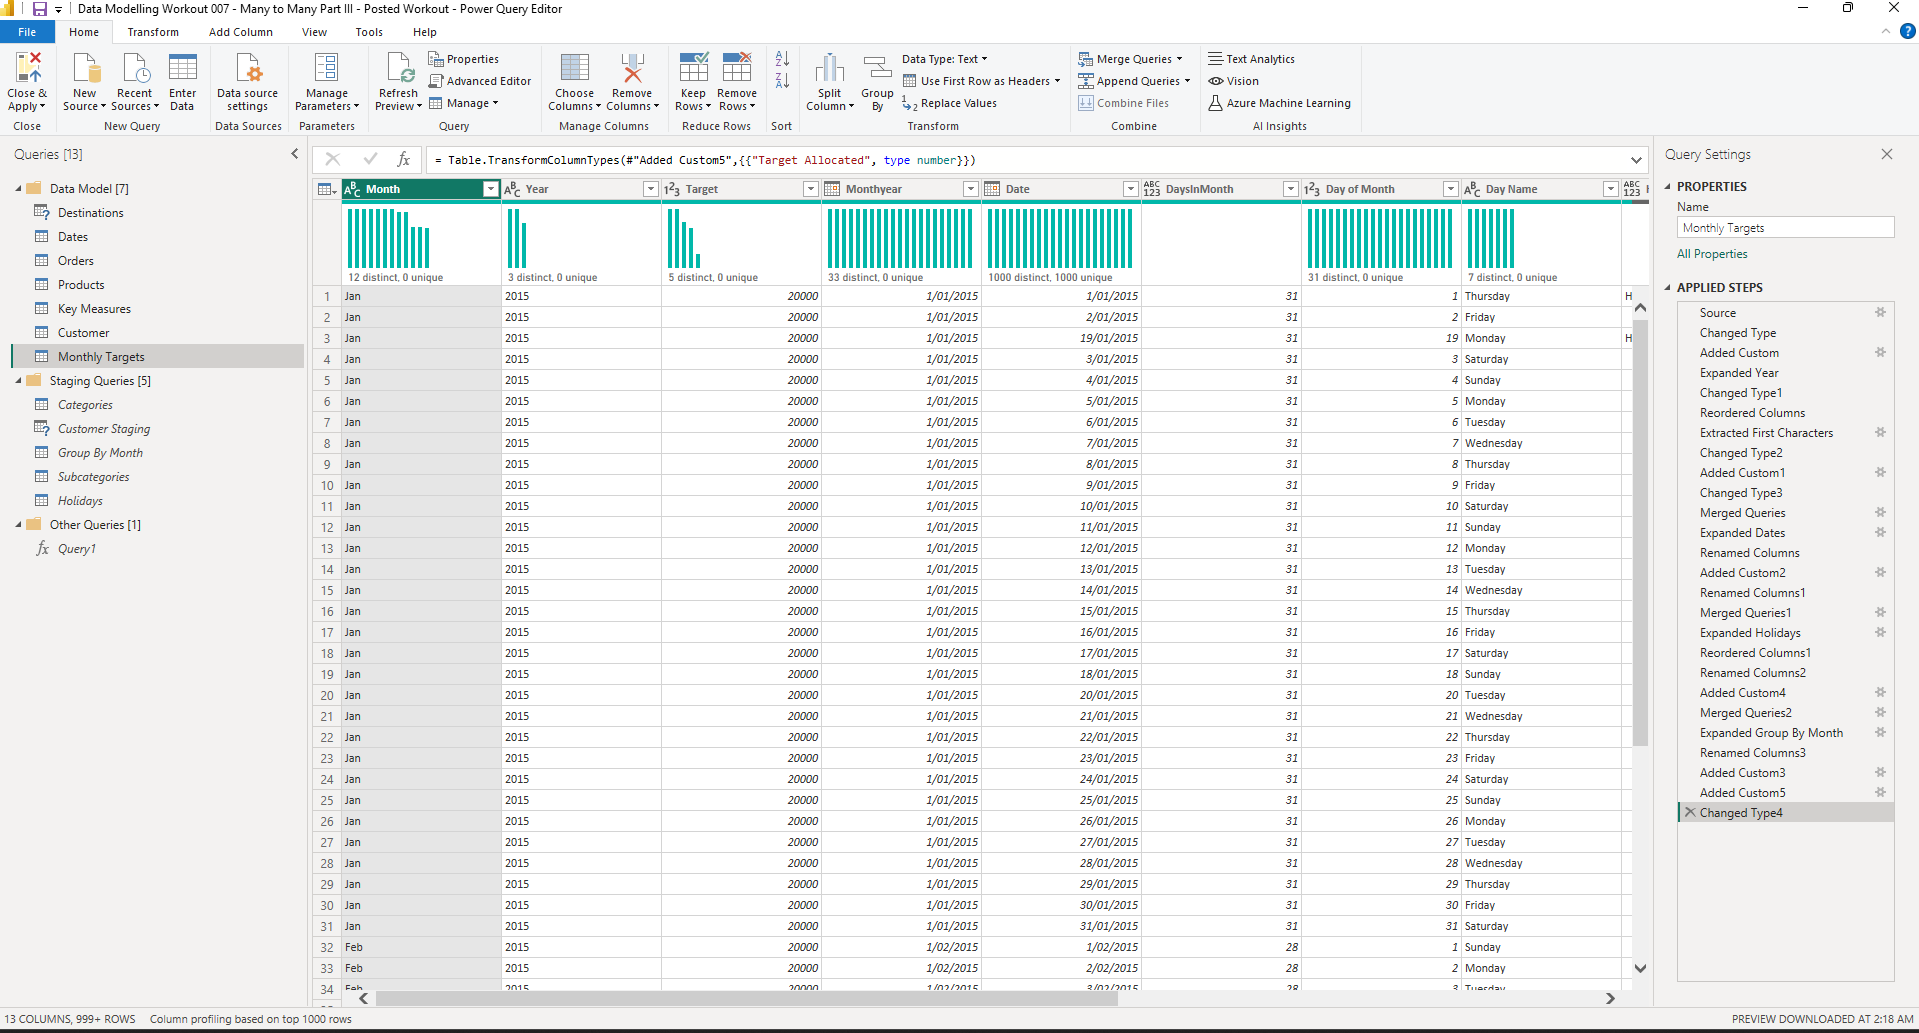
Data Modelling Workout 007 - Many to Many Part III - Posted Workout.pbix (1.2 MB)
Data Modeling 003.xlsx (1.4 MB)