Data Modelling Workout 05 - Many-to-Many (Part I)

Difficulty level:

For this workout, you’re taking a break from your high-powered BI consulting job to help out a friend who runs a beloved local bookstore. They are trying to build a Power BI report to analyze information about books, authors and publishers.

However, they are running into problems getting their slicers and DAX to work properly.

You ask how they’re handling the many-to-many relationship and just get blank stares. You explain that this scenario is a little tricker than than standard star schema model because a book can have multiple authors and a given author may have written multiple books. (For this exercise, assume that each edition of book has only one publisher though).

“Well, doesn’t that make the DAX really complicated” , they ask you?

“Nope. If you nail your data model, you can use the simplest “baby DAX” and it will work perfectly”, you answer.

‘*************************************************’

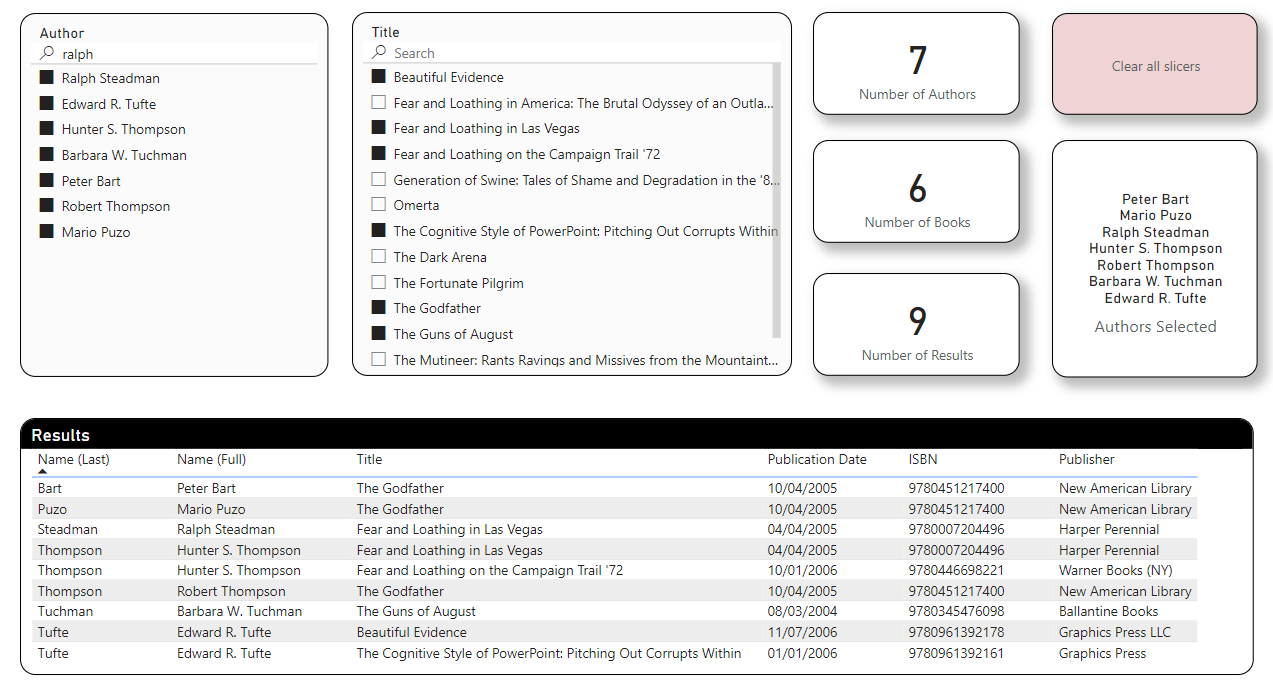
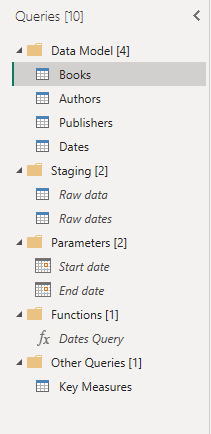
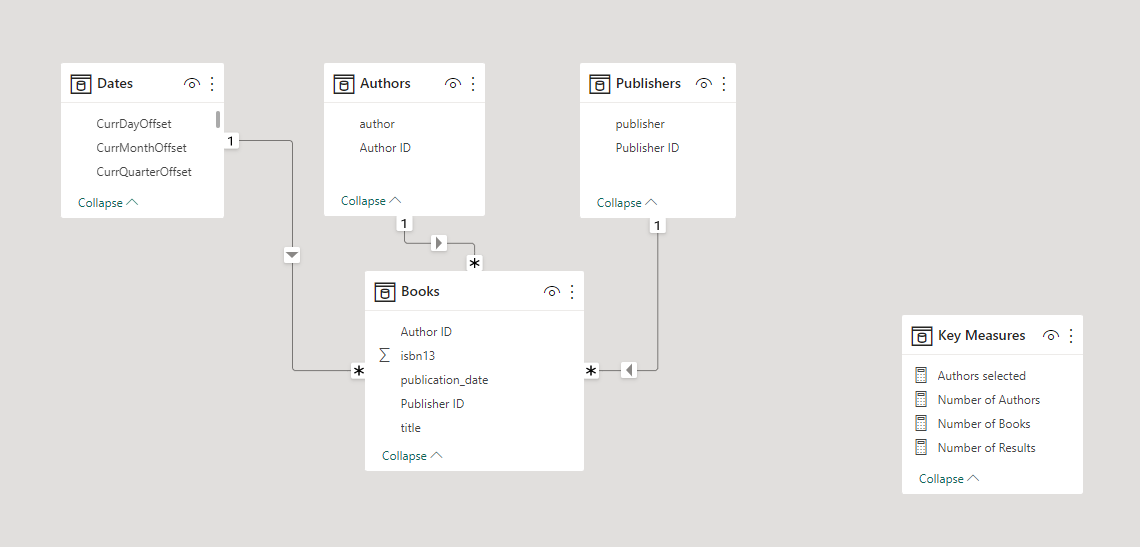
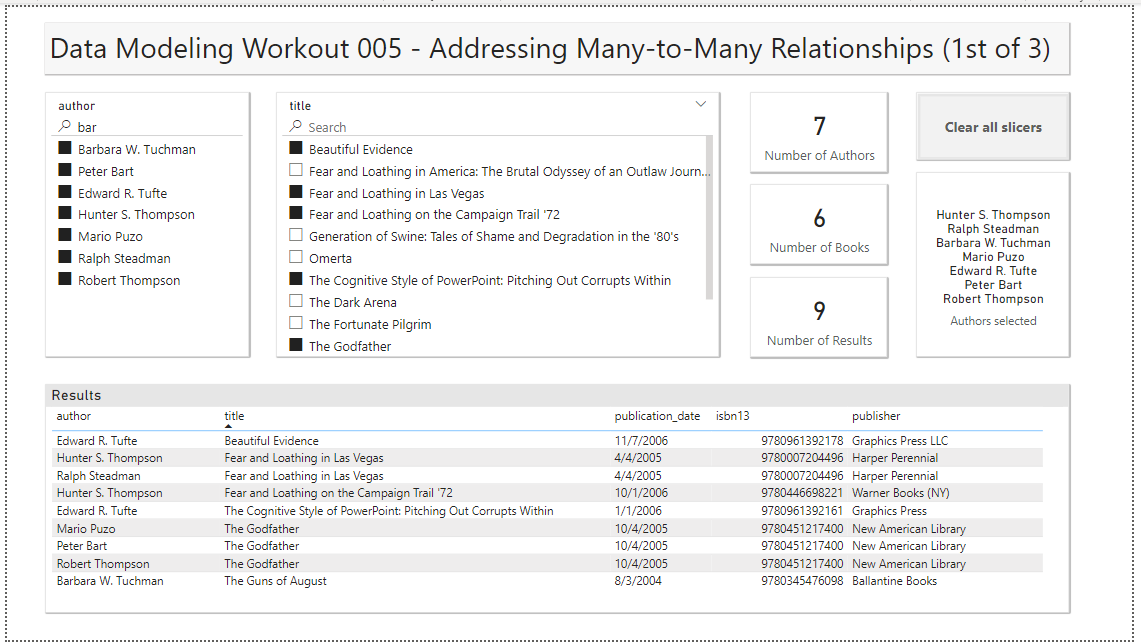
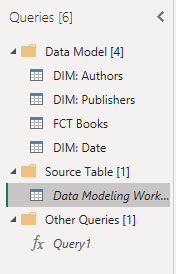
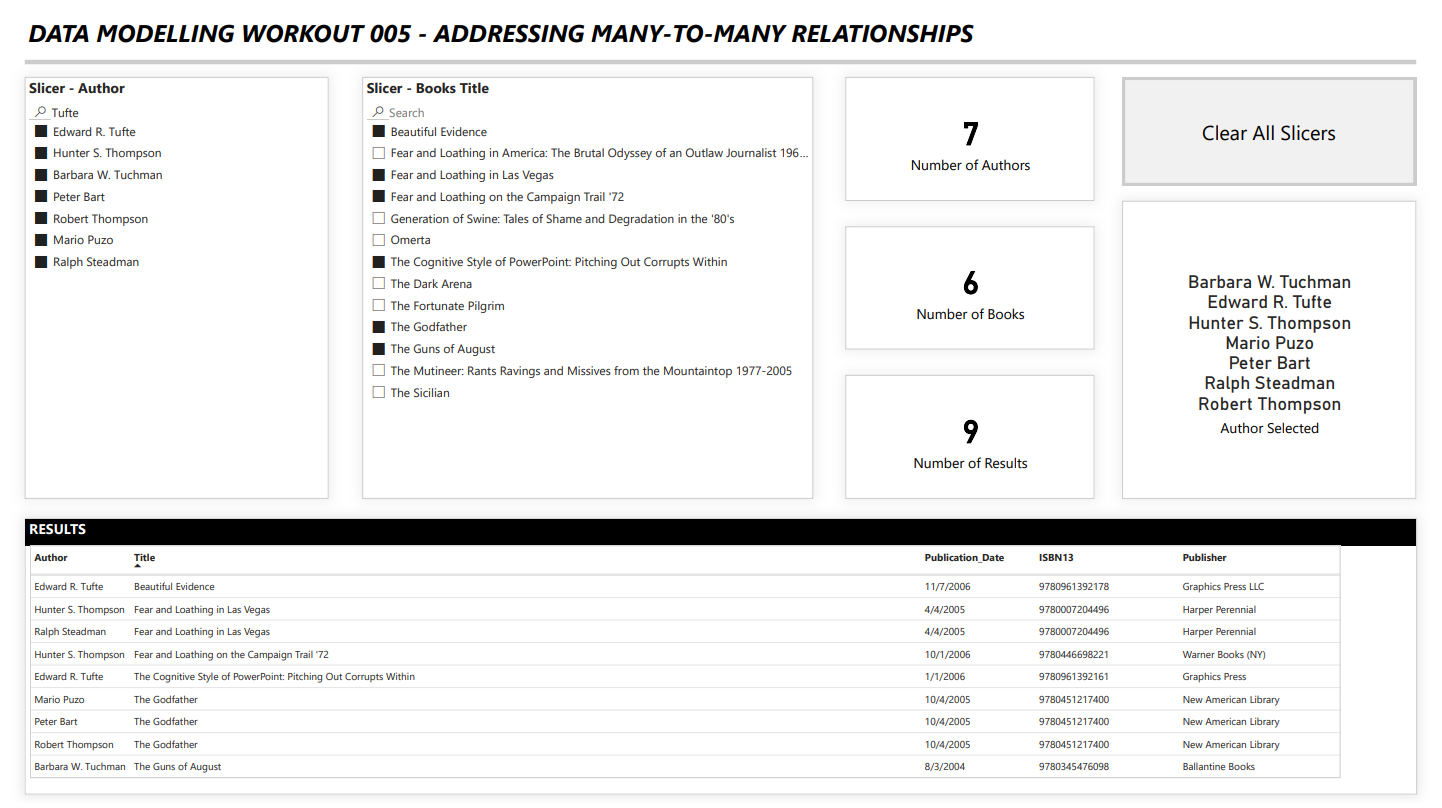
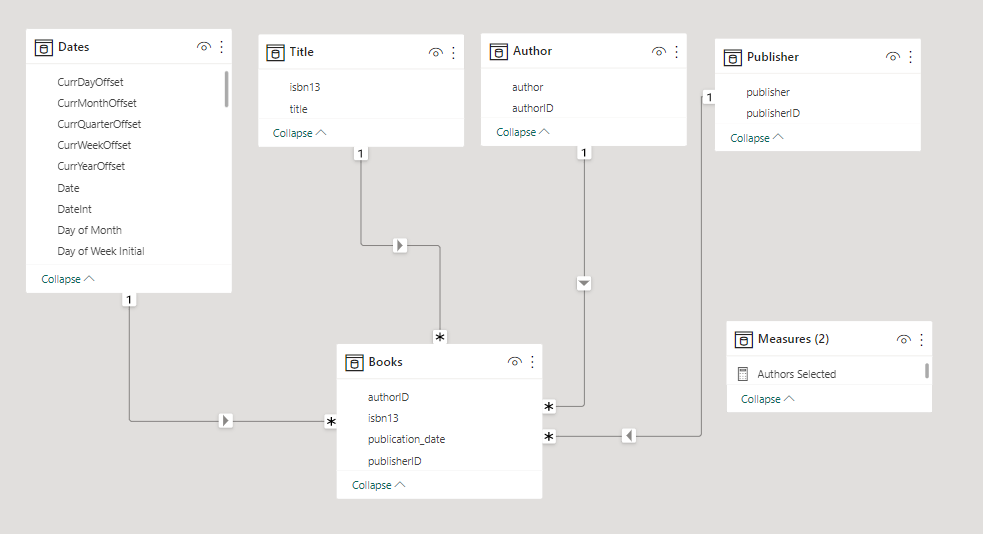
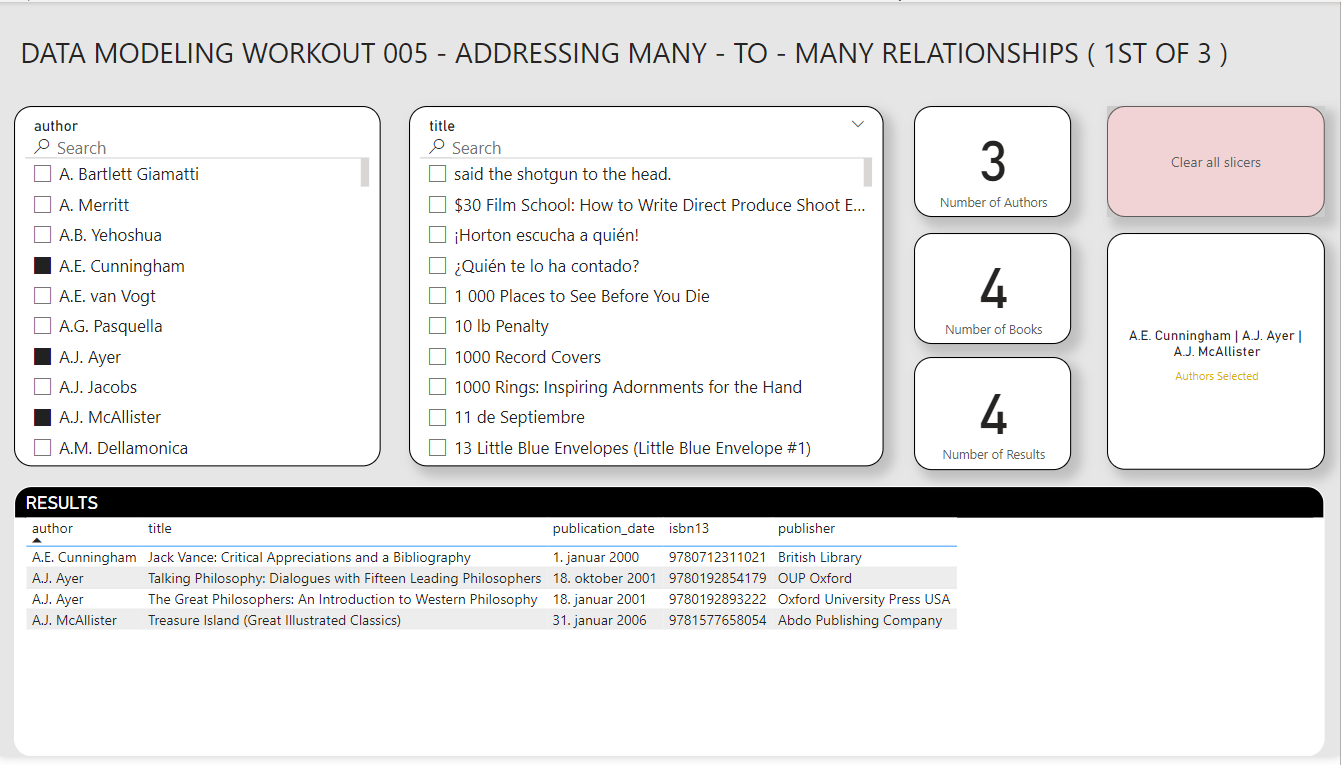
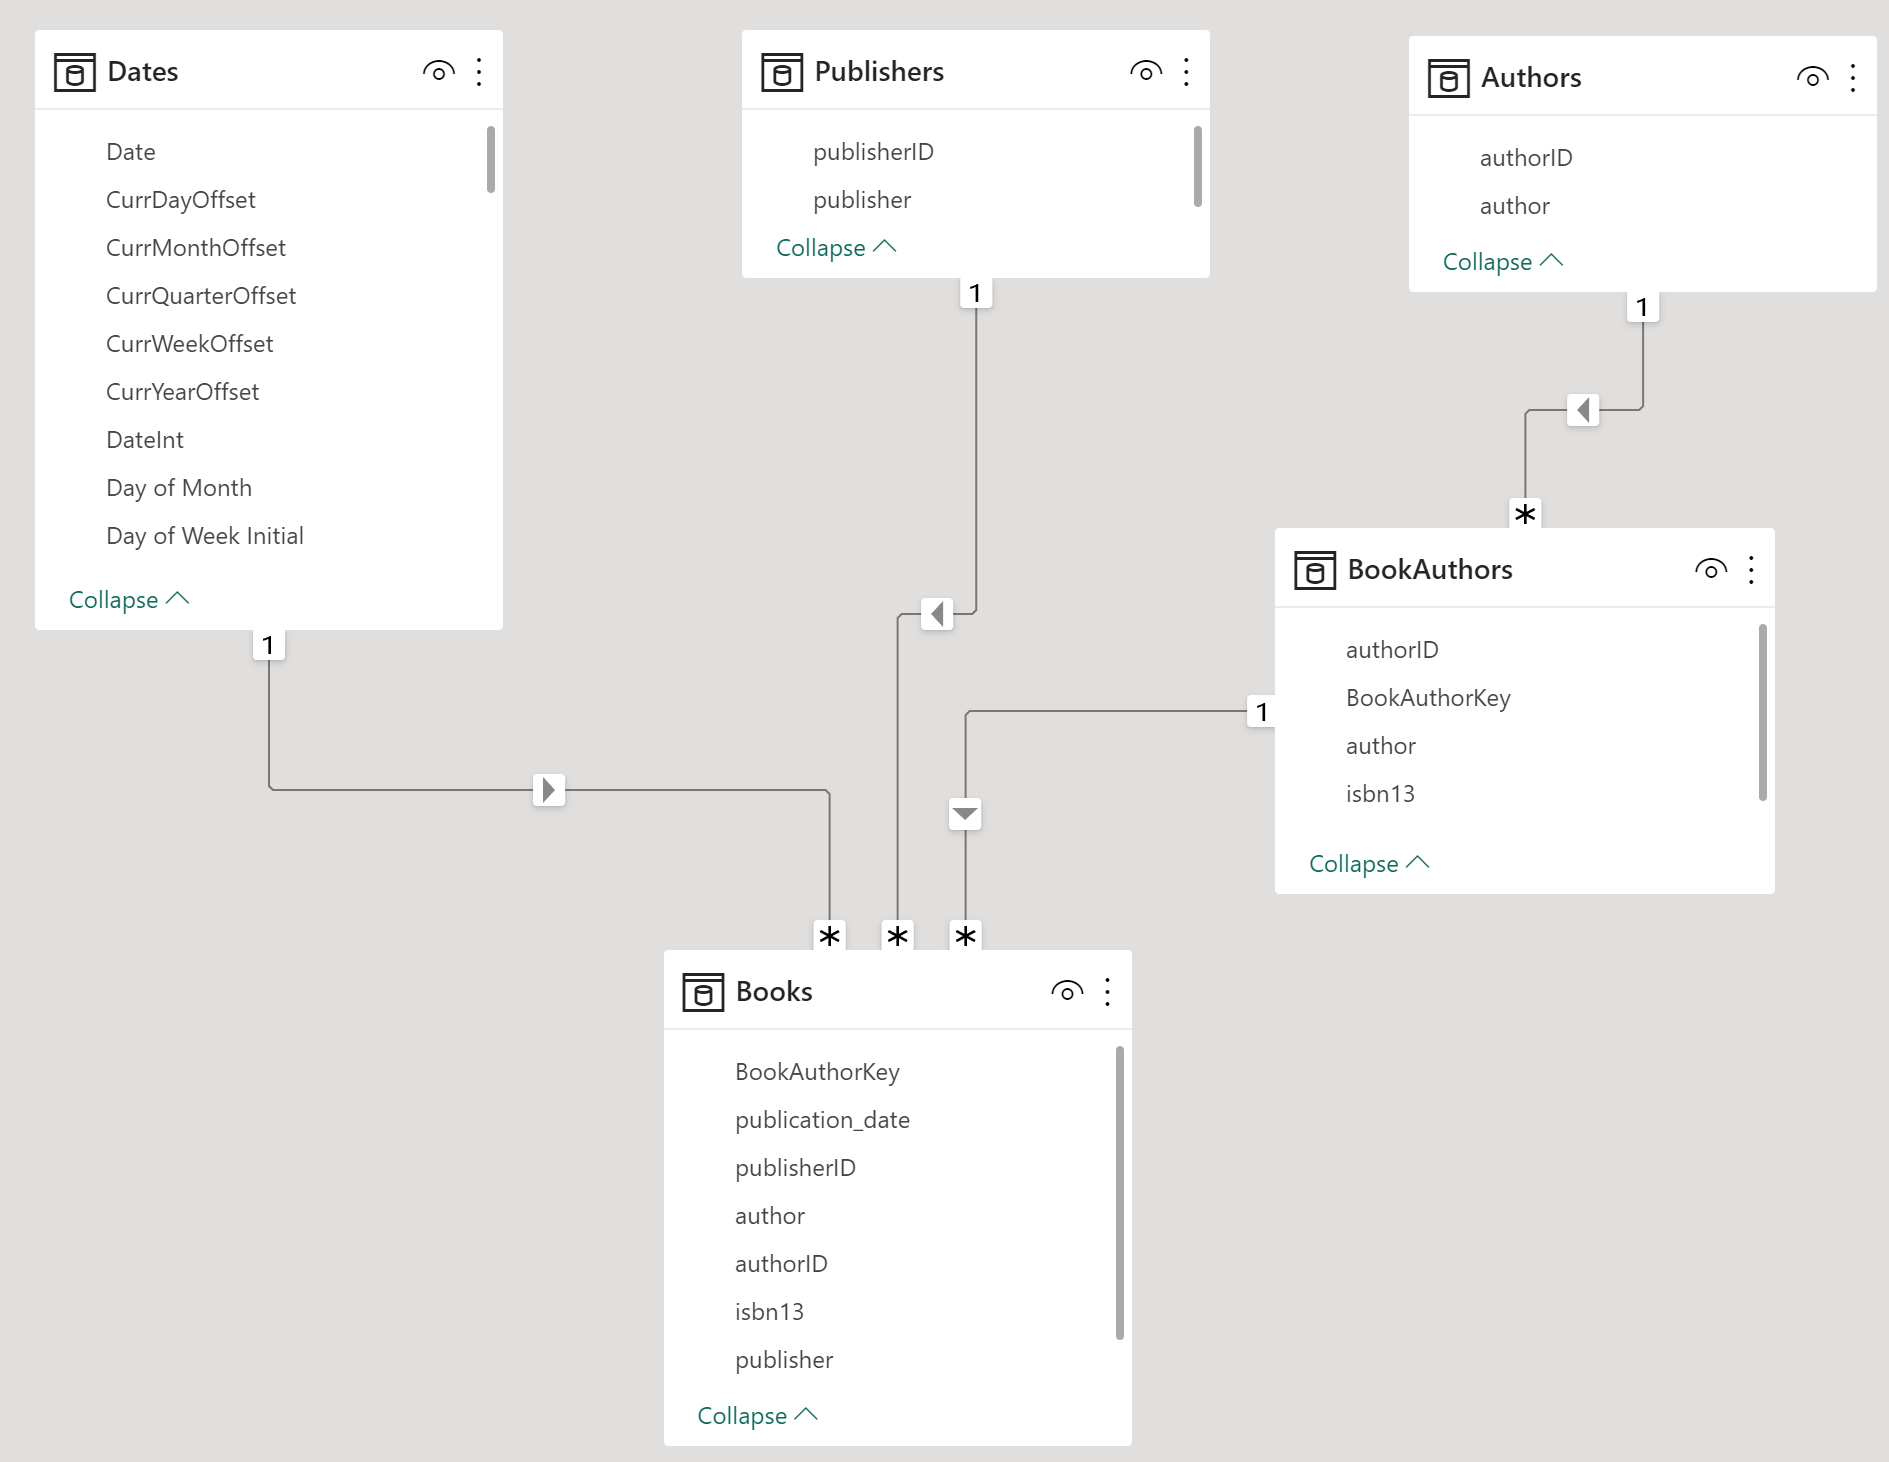
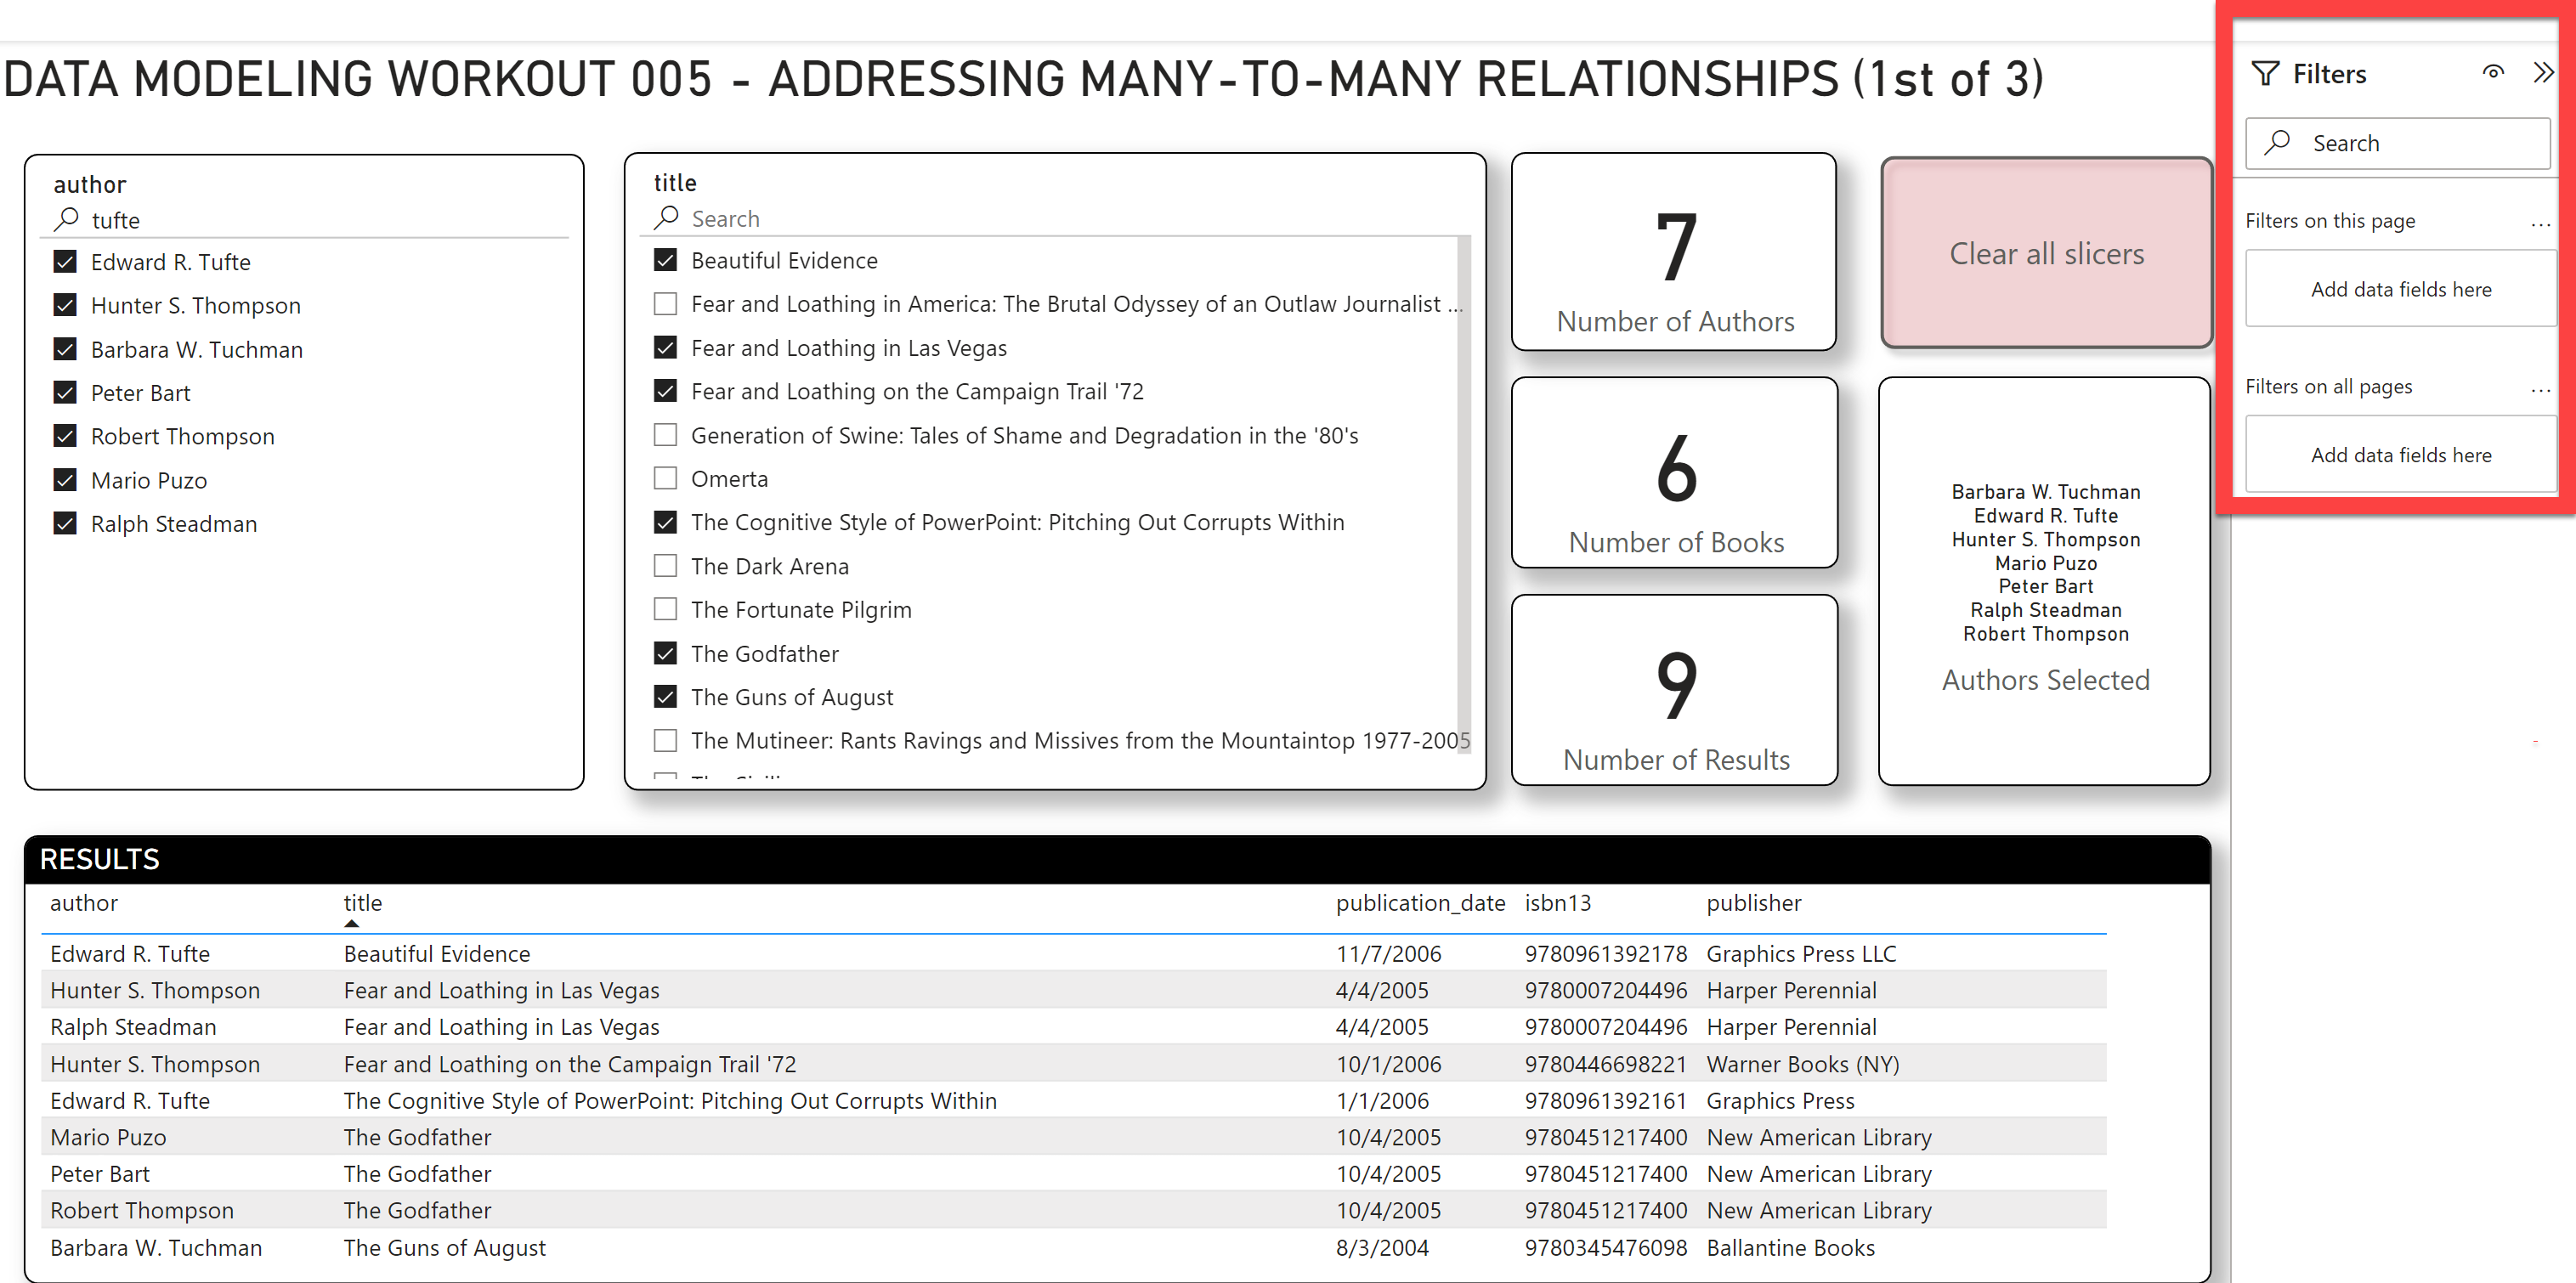
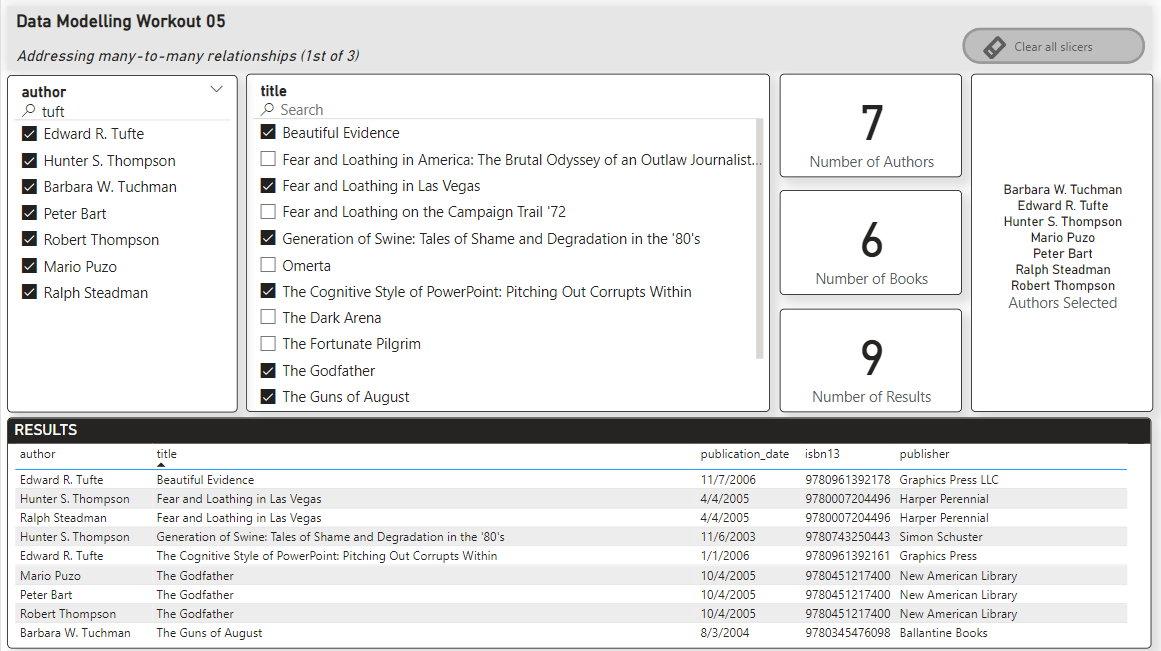
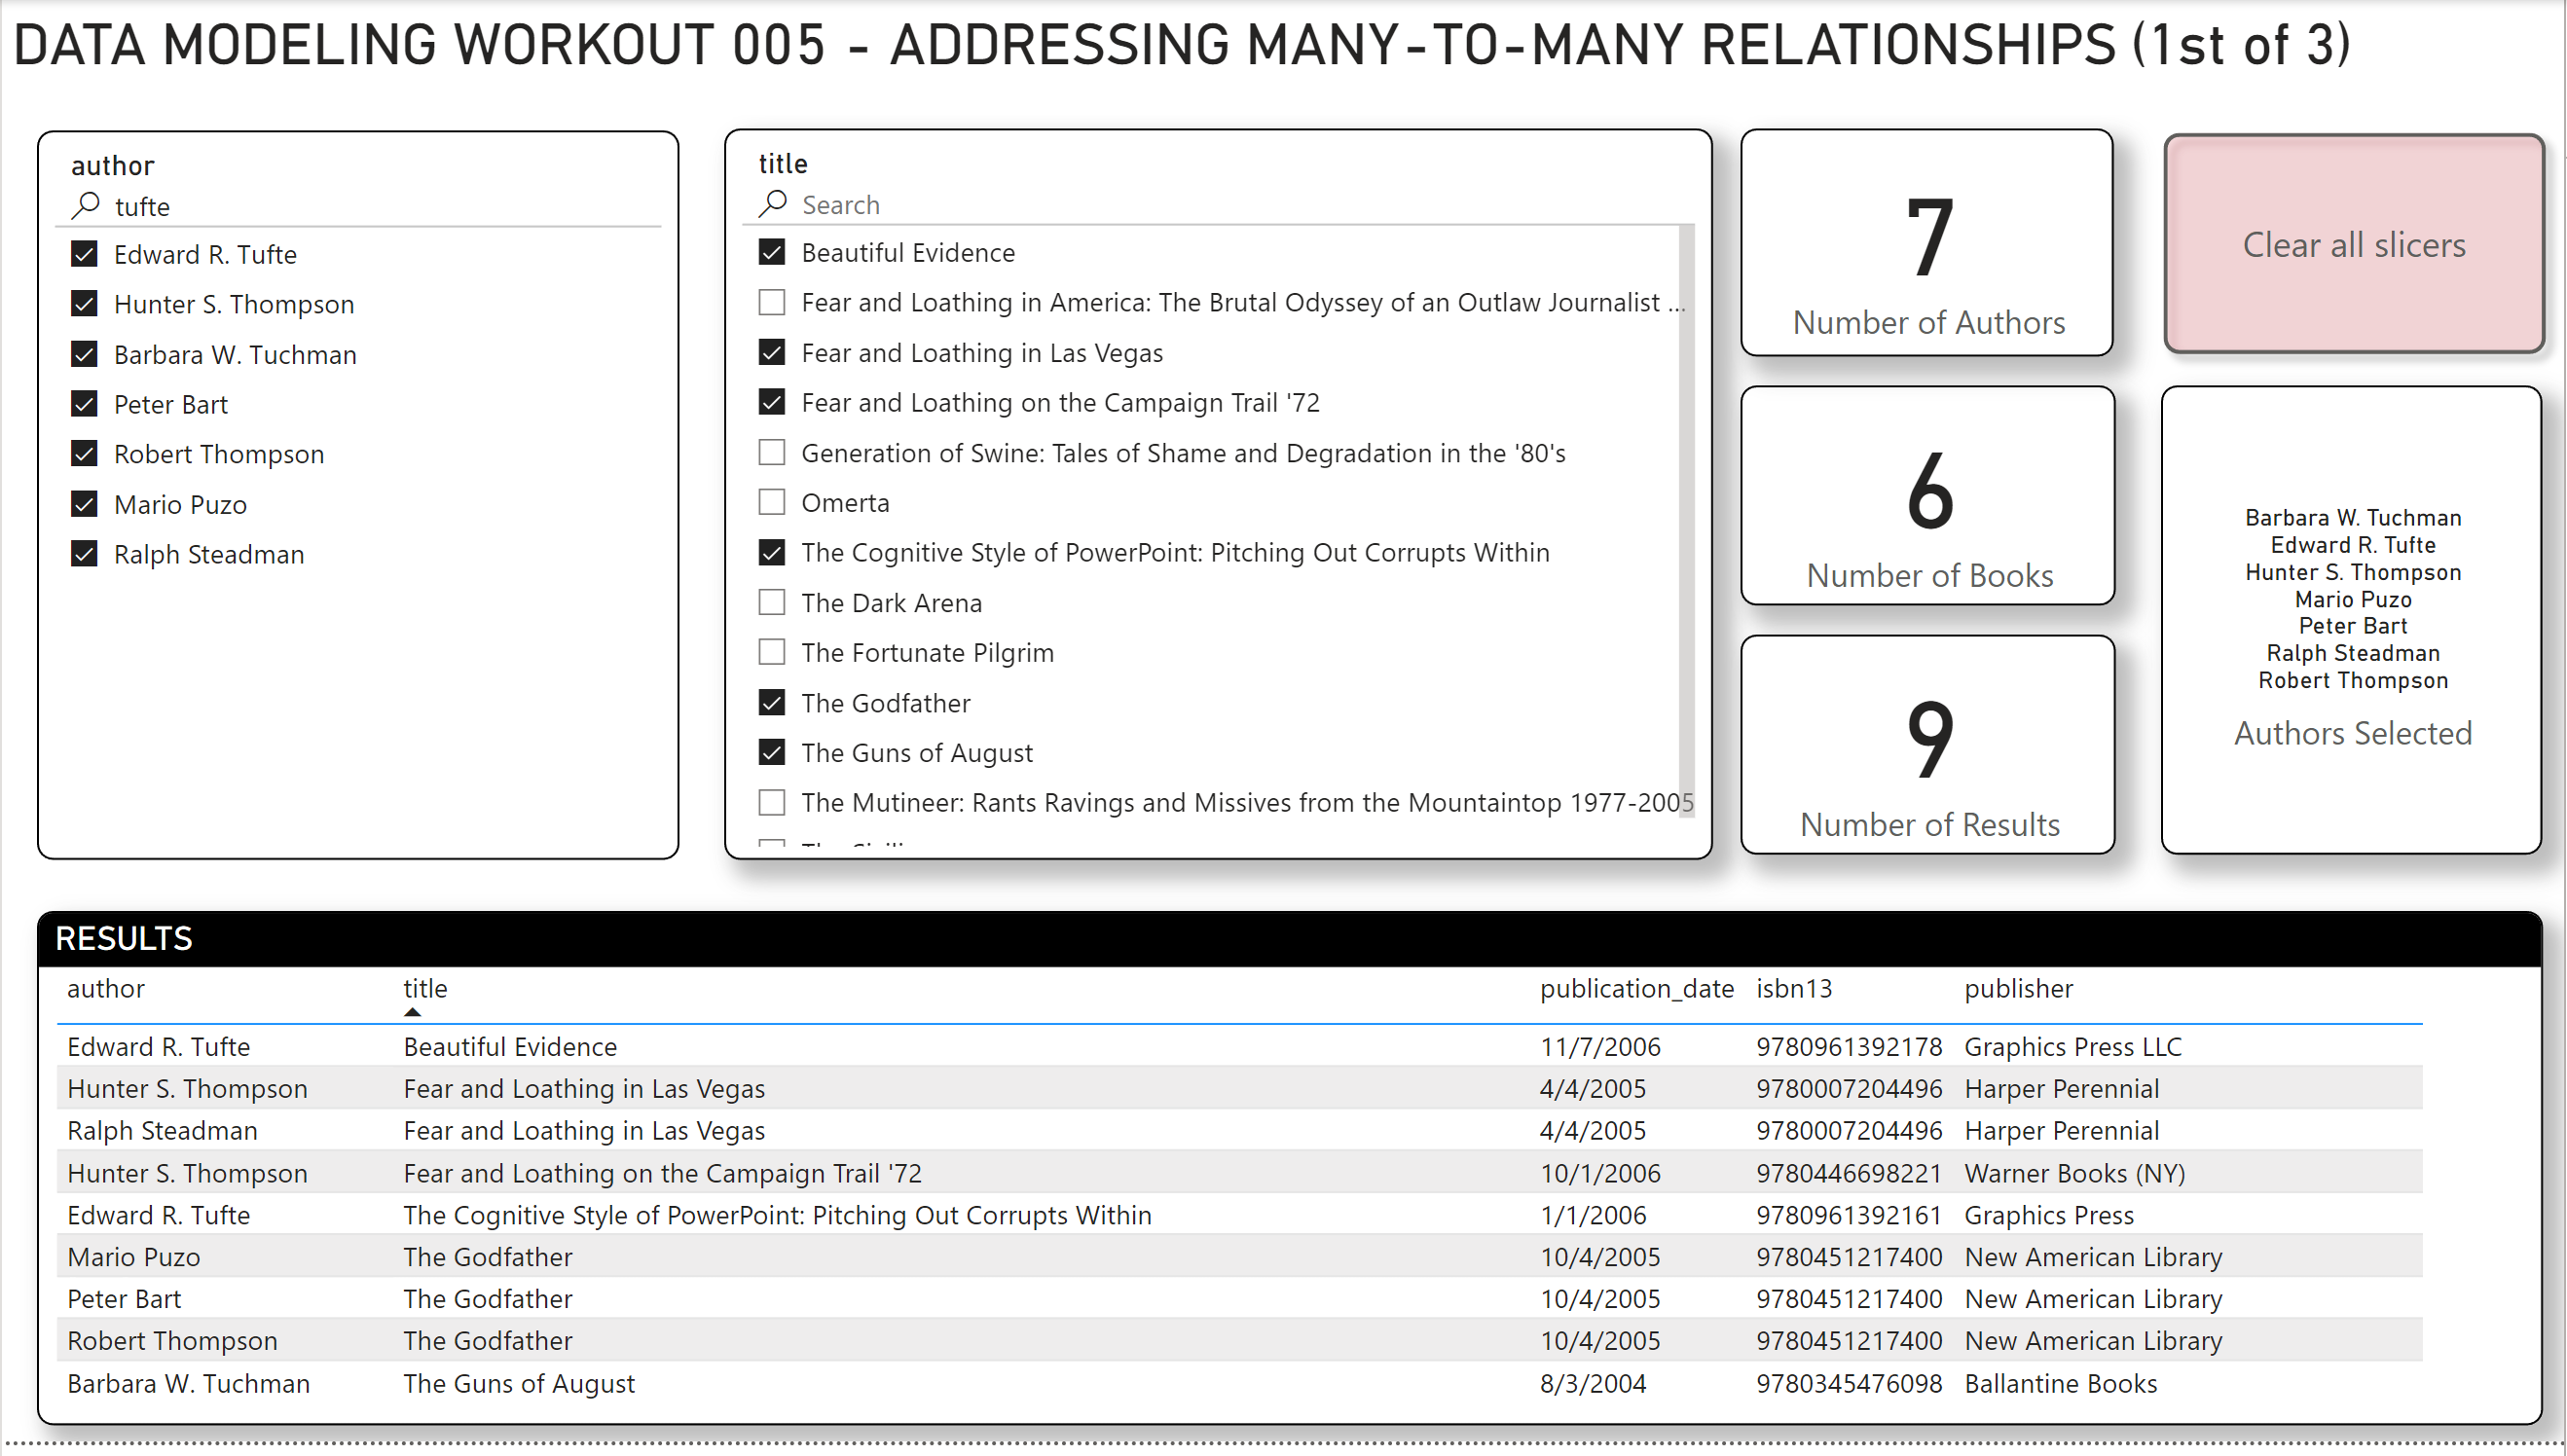
So, your task for this workout is to re-create the report below, using:
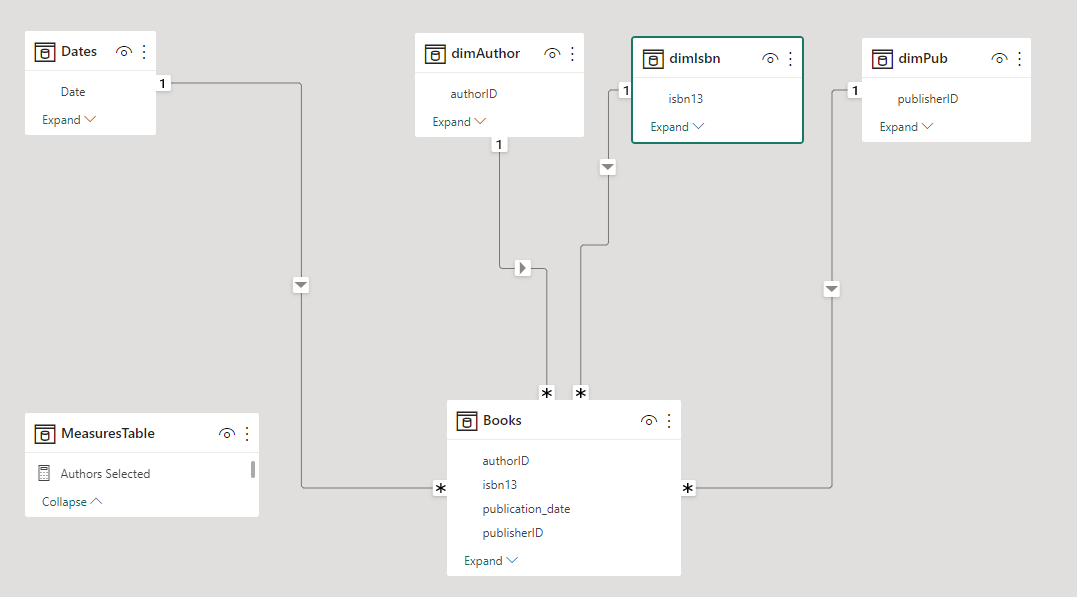
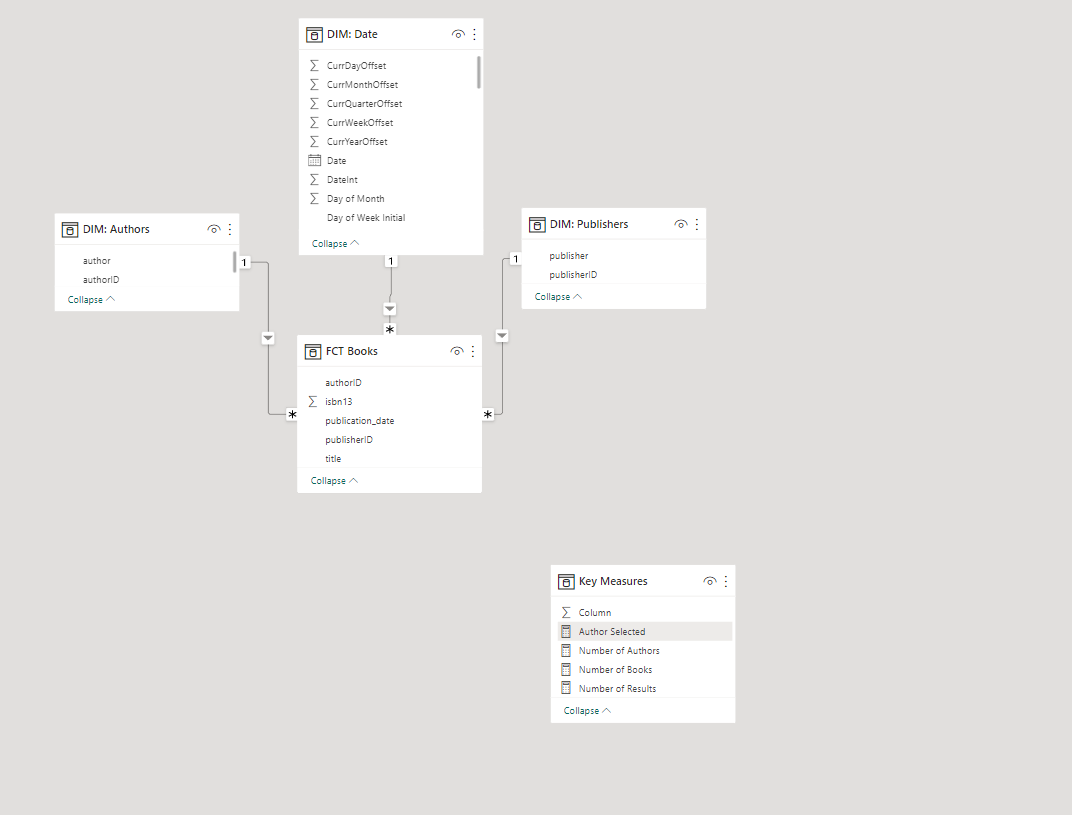
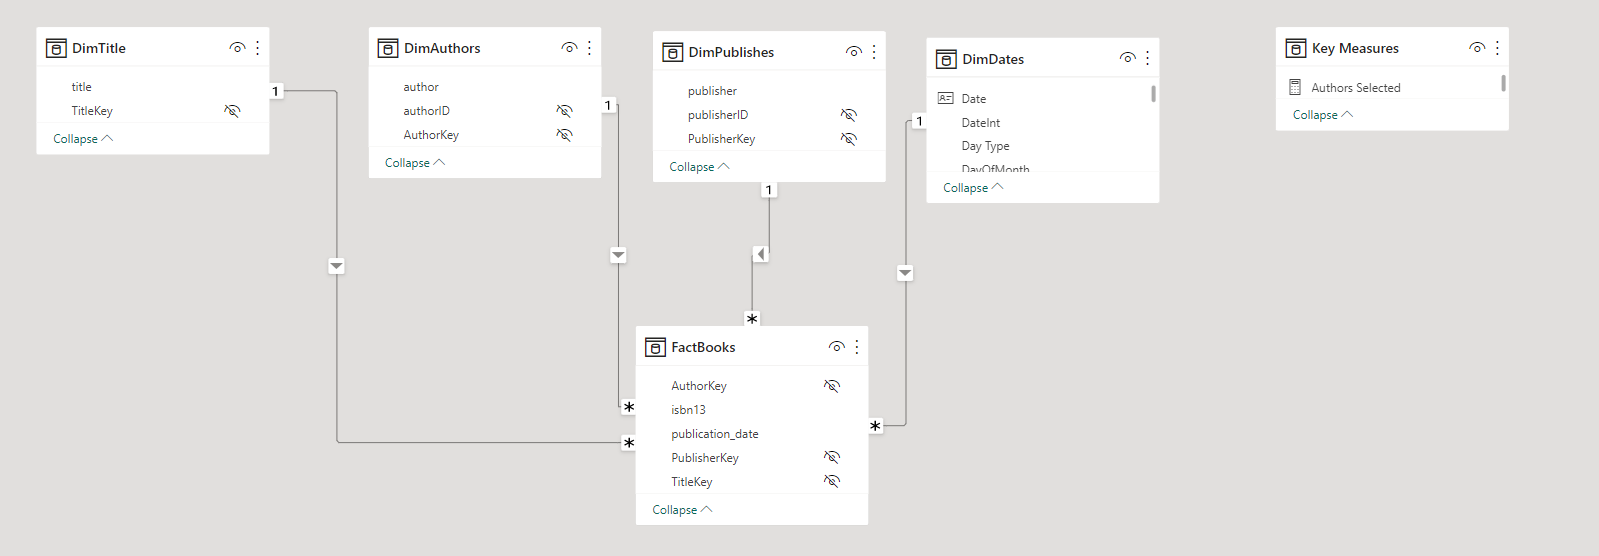
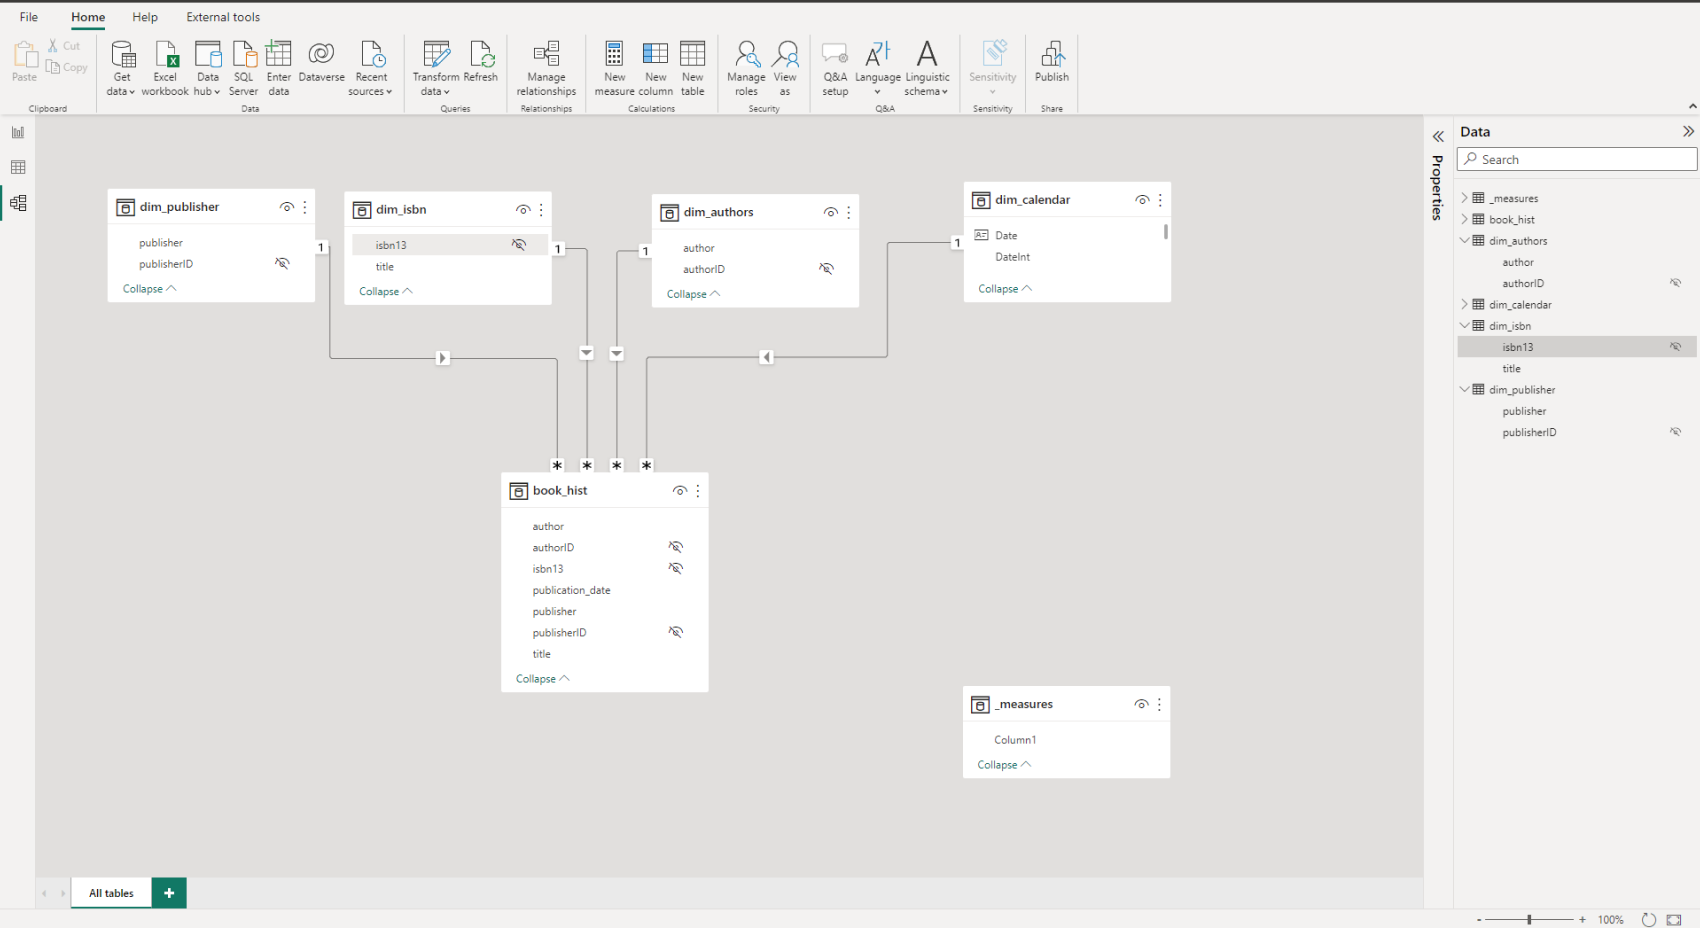
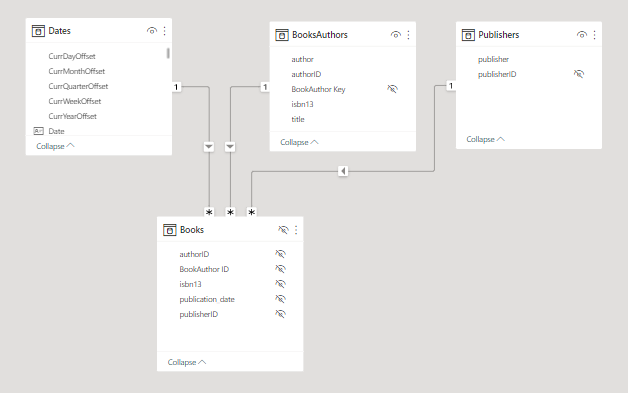
:small_orange_diamond: Only one-to-many relationships, no bidirectional relationships
:small_orange_diamond: Only the following simple DAX measures for the card visuals counting number of authors, number of books and number of results:

Number of Authors = DISTINCTCOUNT( Books[authorID] )
Number of Books = DISTINCTCOUNT( Books[isbn13] ) 
Number of Results = COUNTROWS( Books )

Note: Use isbn13 as the unique identifier for books

Use any DAX you like for the card mirroring the authors selected in the slicer

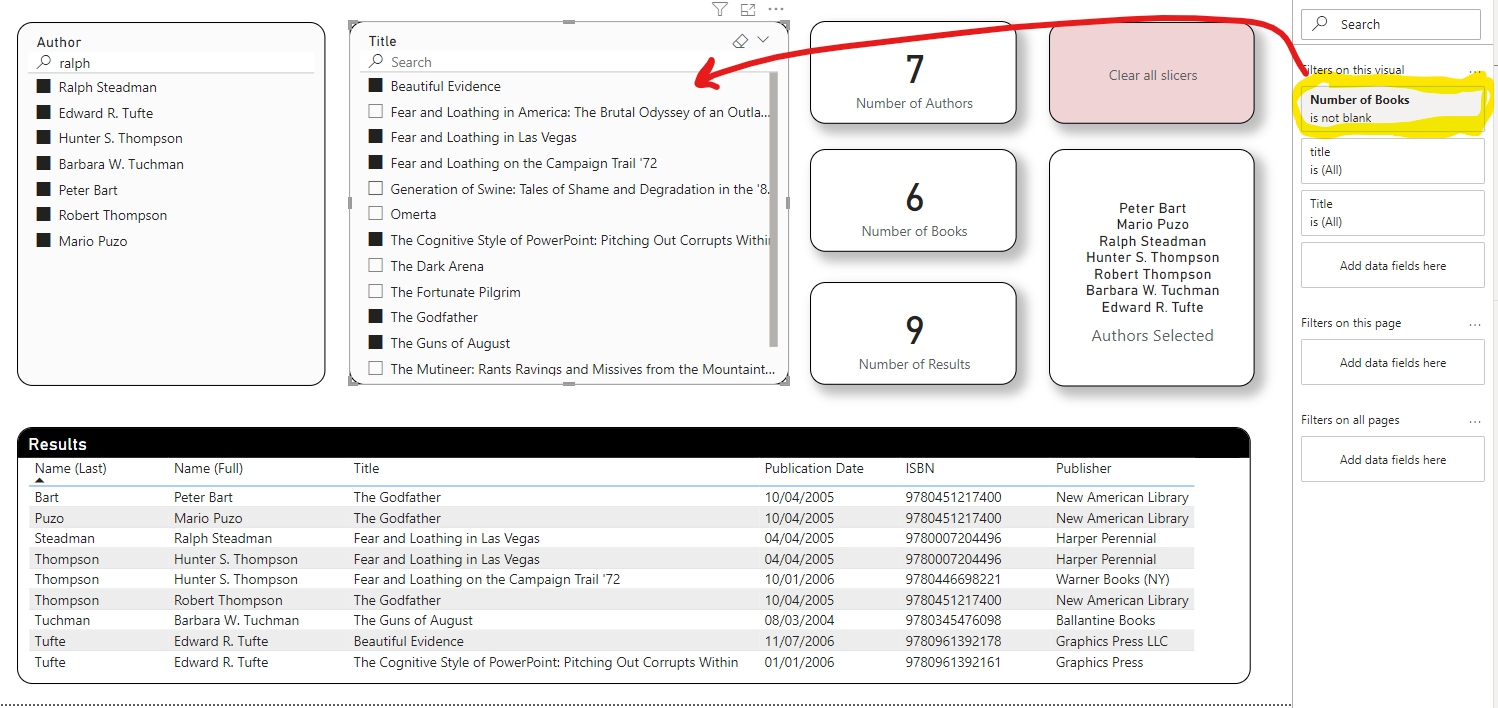
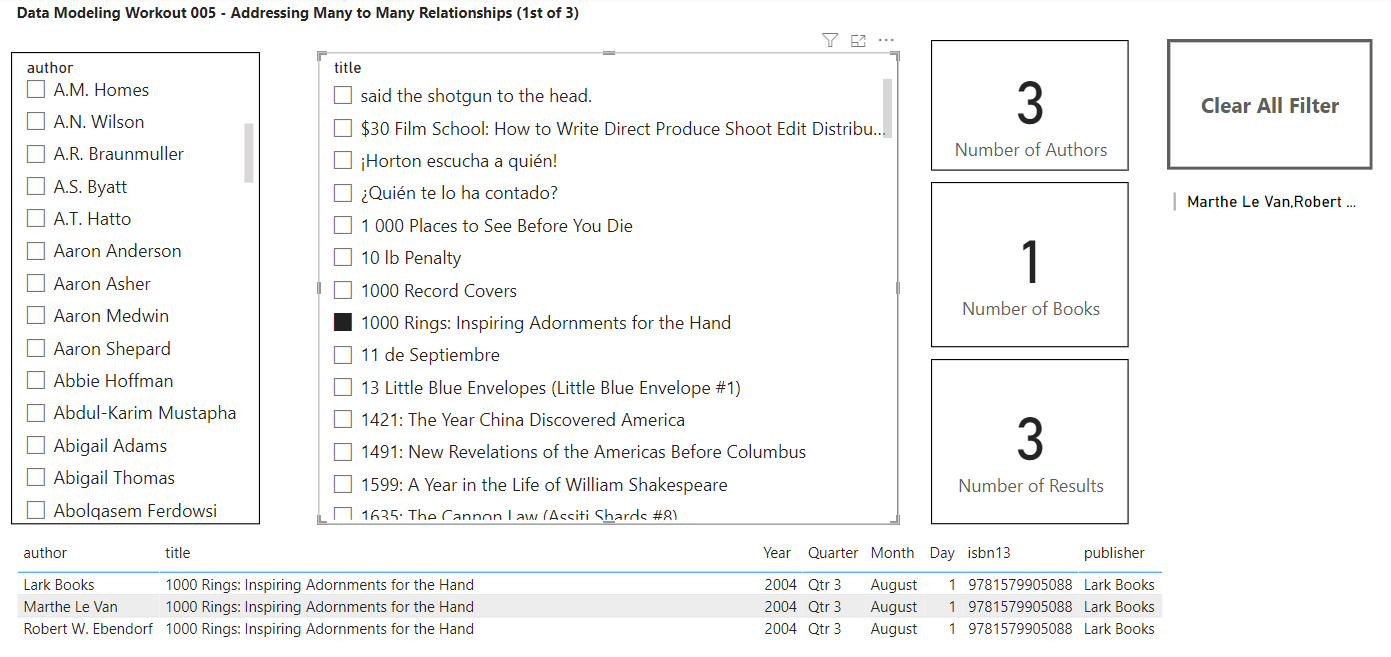
Your slicers also have to synch properly (i.e., when you select authors, the title slicer should filter to show only the books associated with those authors, or when you select titles it should filter the authors slicer to show only the authors associated with those selected books).

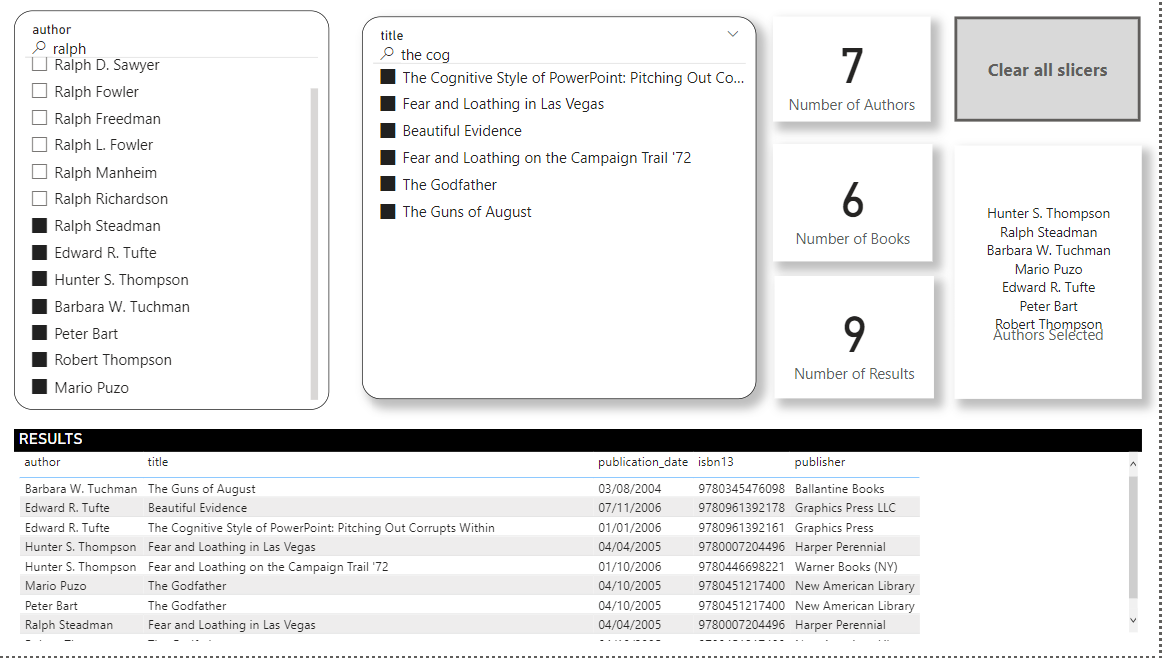
Also add text search capability to each of the slicers, per the screenshot below.

For your Dates table, use the Enterprise DNA Extended Date Table. The code for the table is available here:

eDNA Data Table Code

Extended Date Table (Power Query M function)

Other than those requirements, model the data in whatever way you think best.

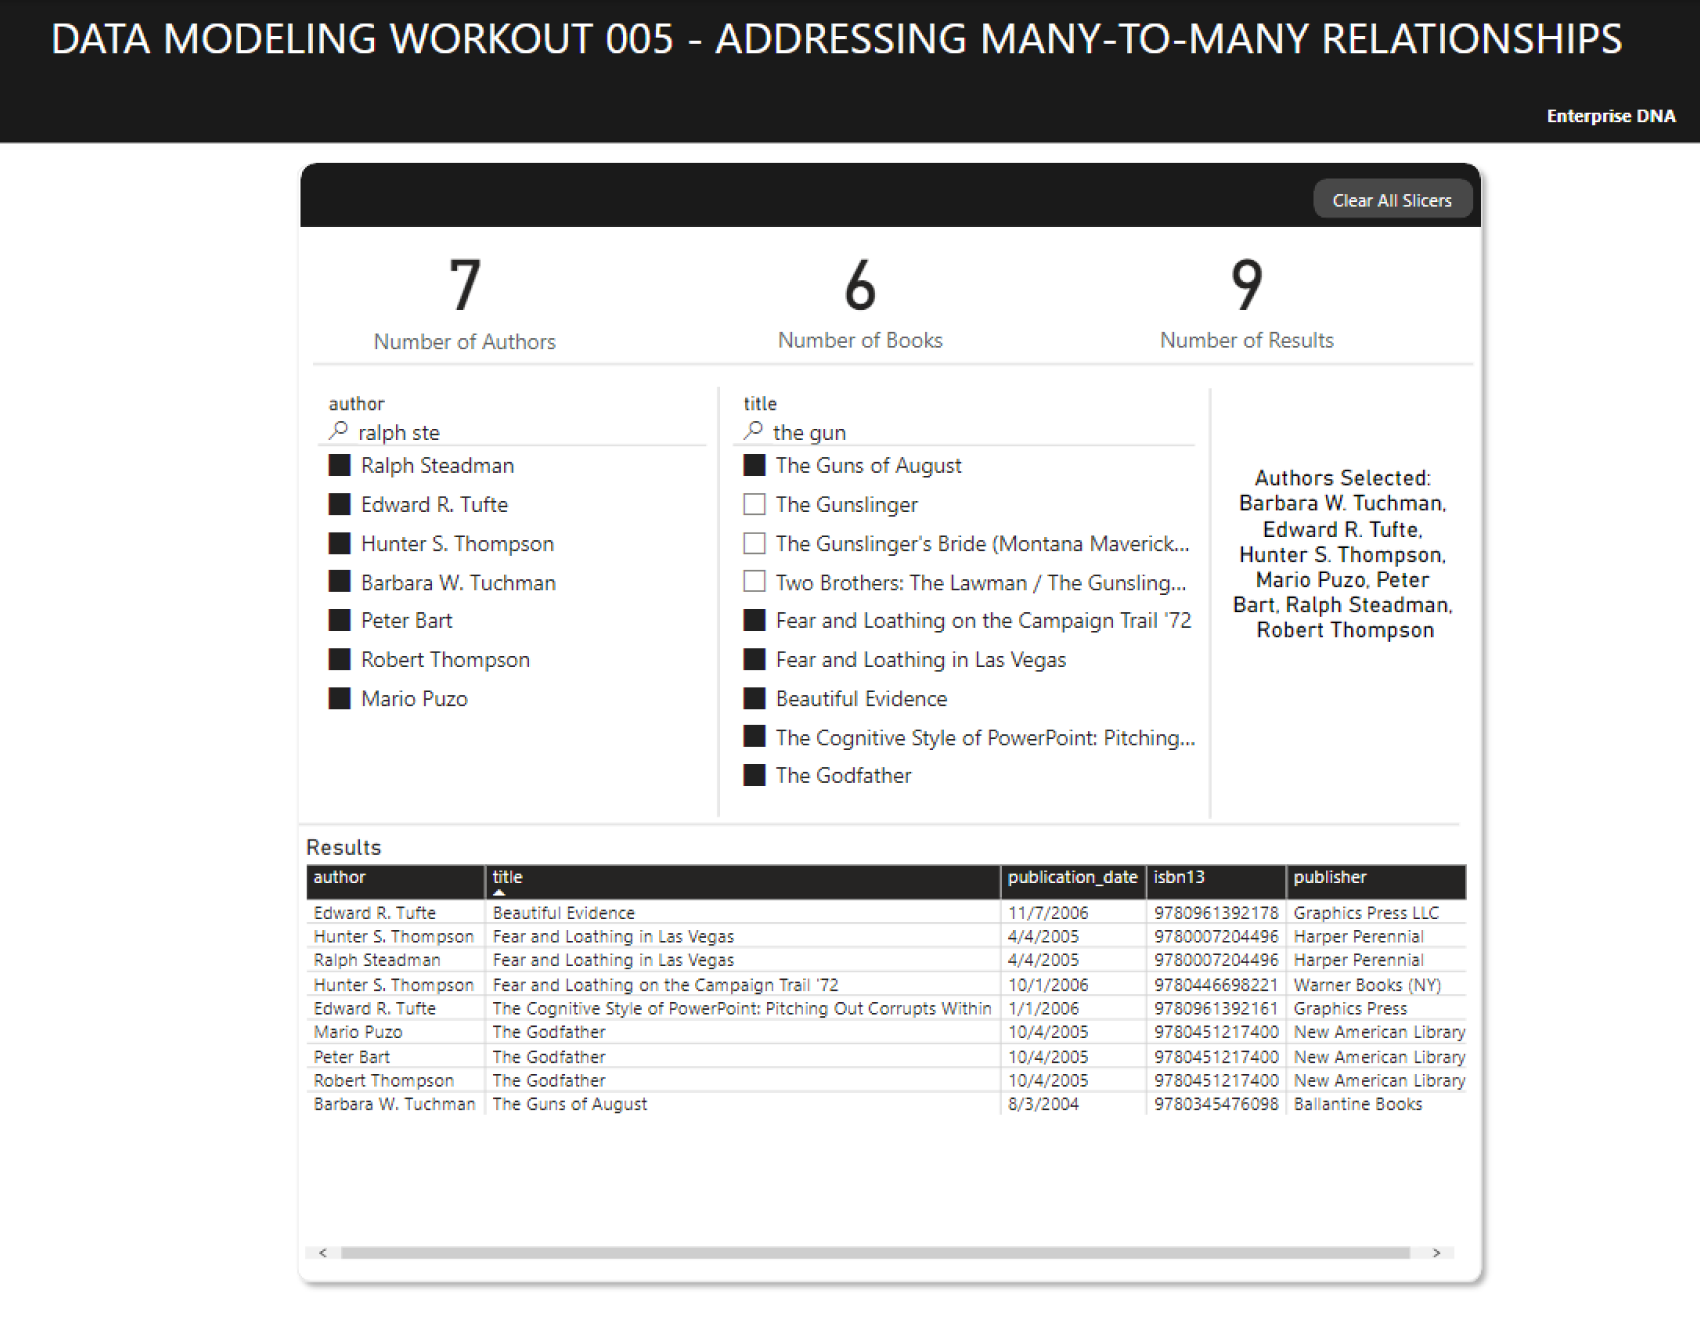
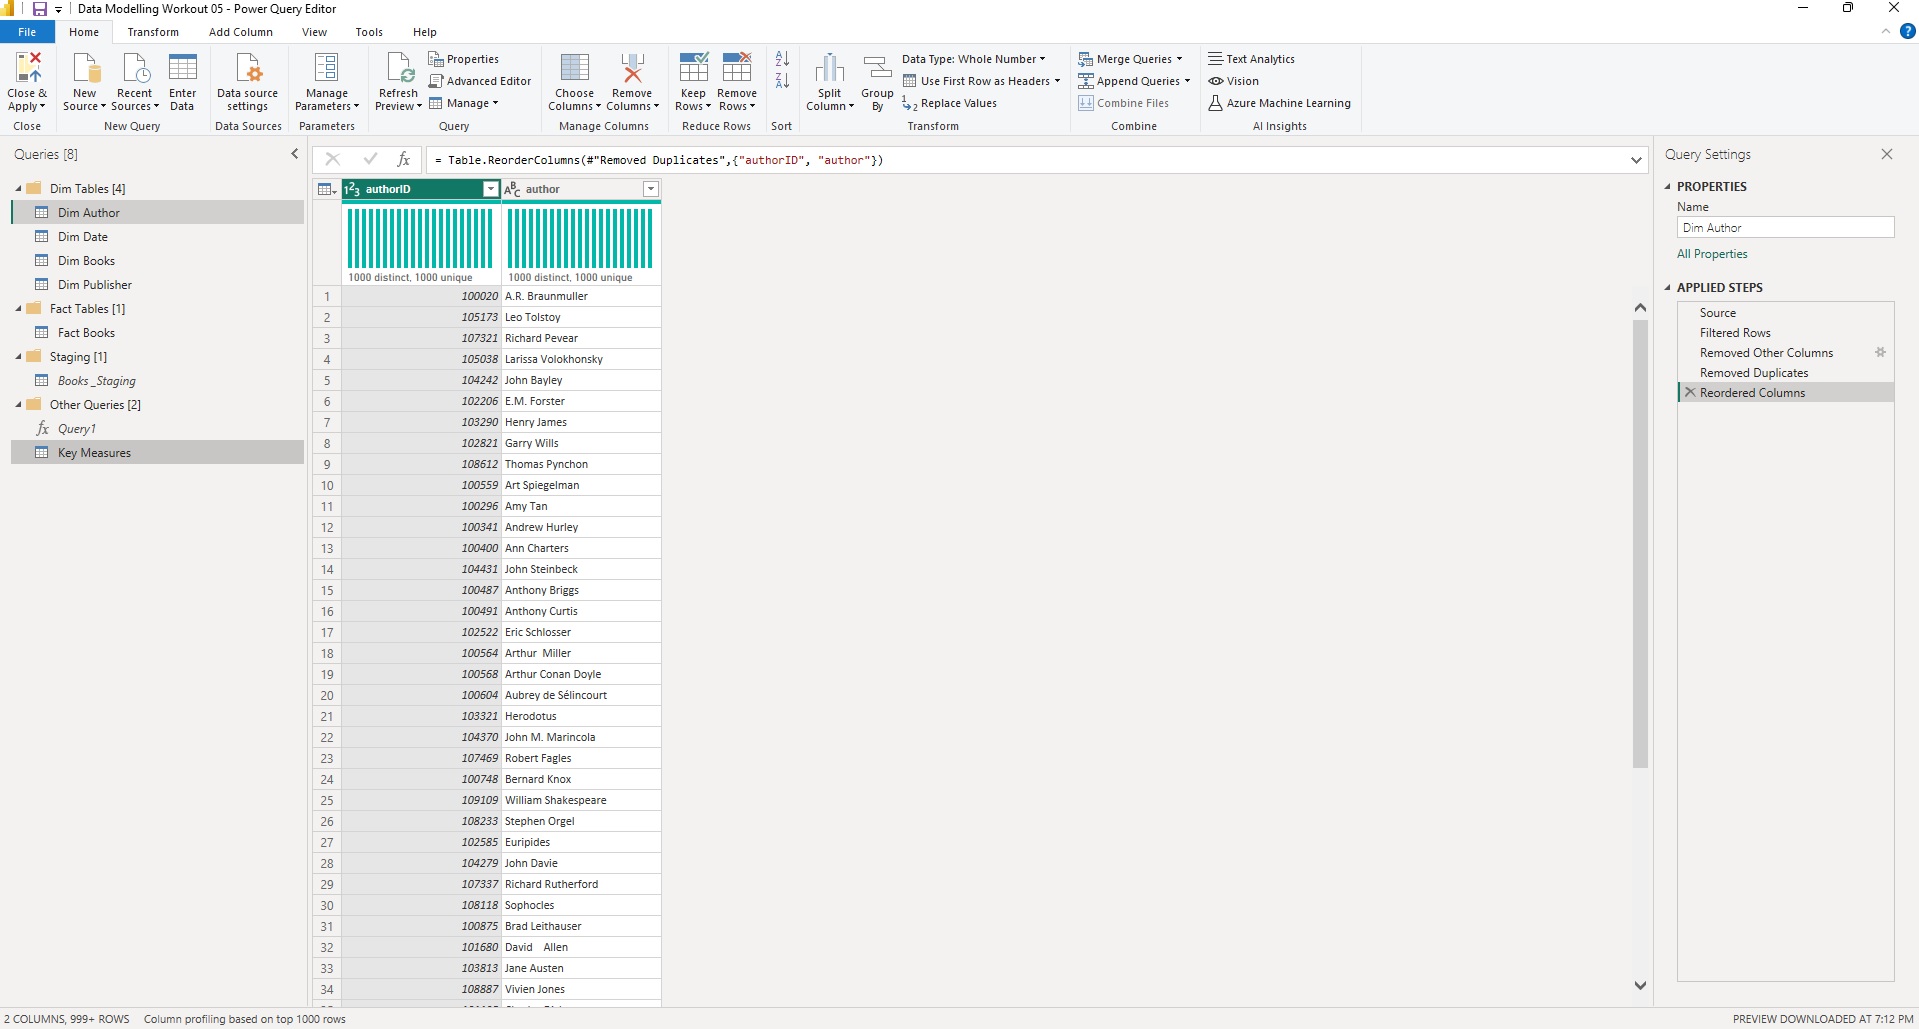
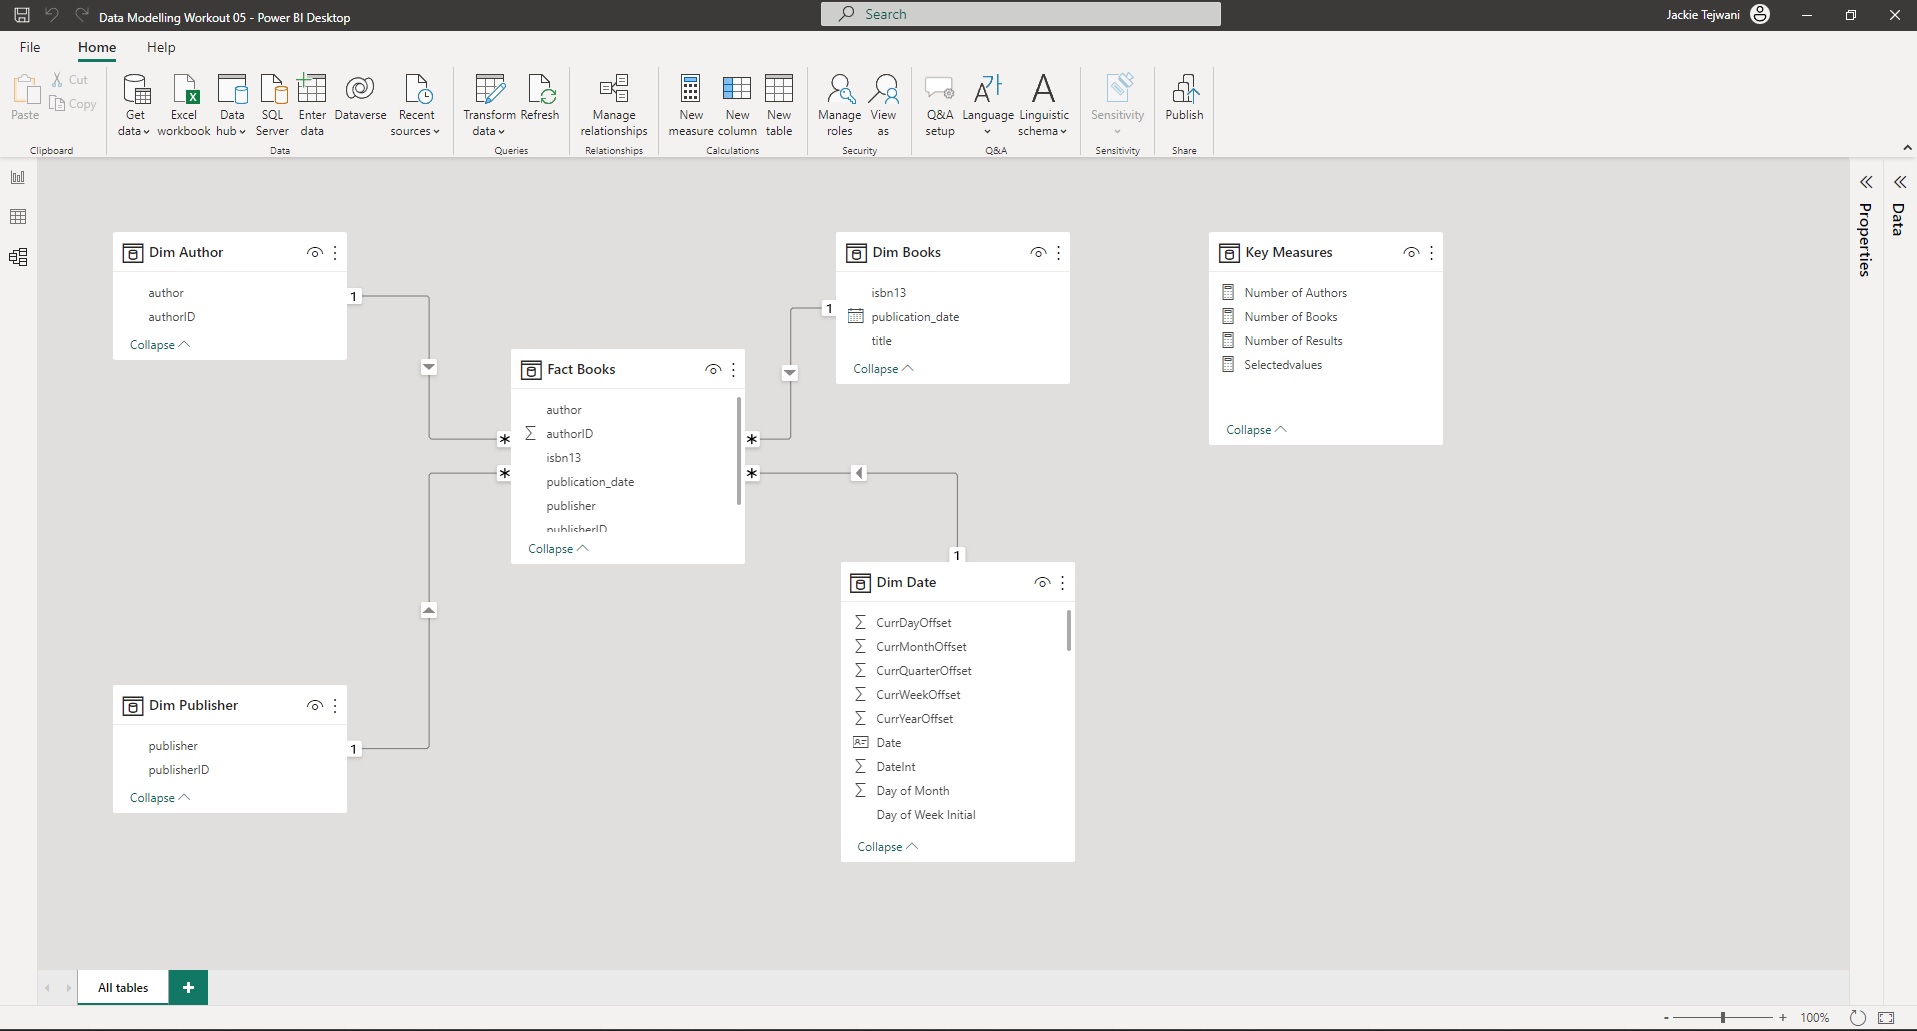
Here the screenshot of the results you want to achieve:

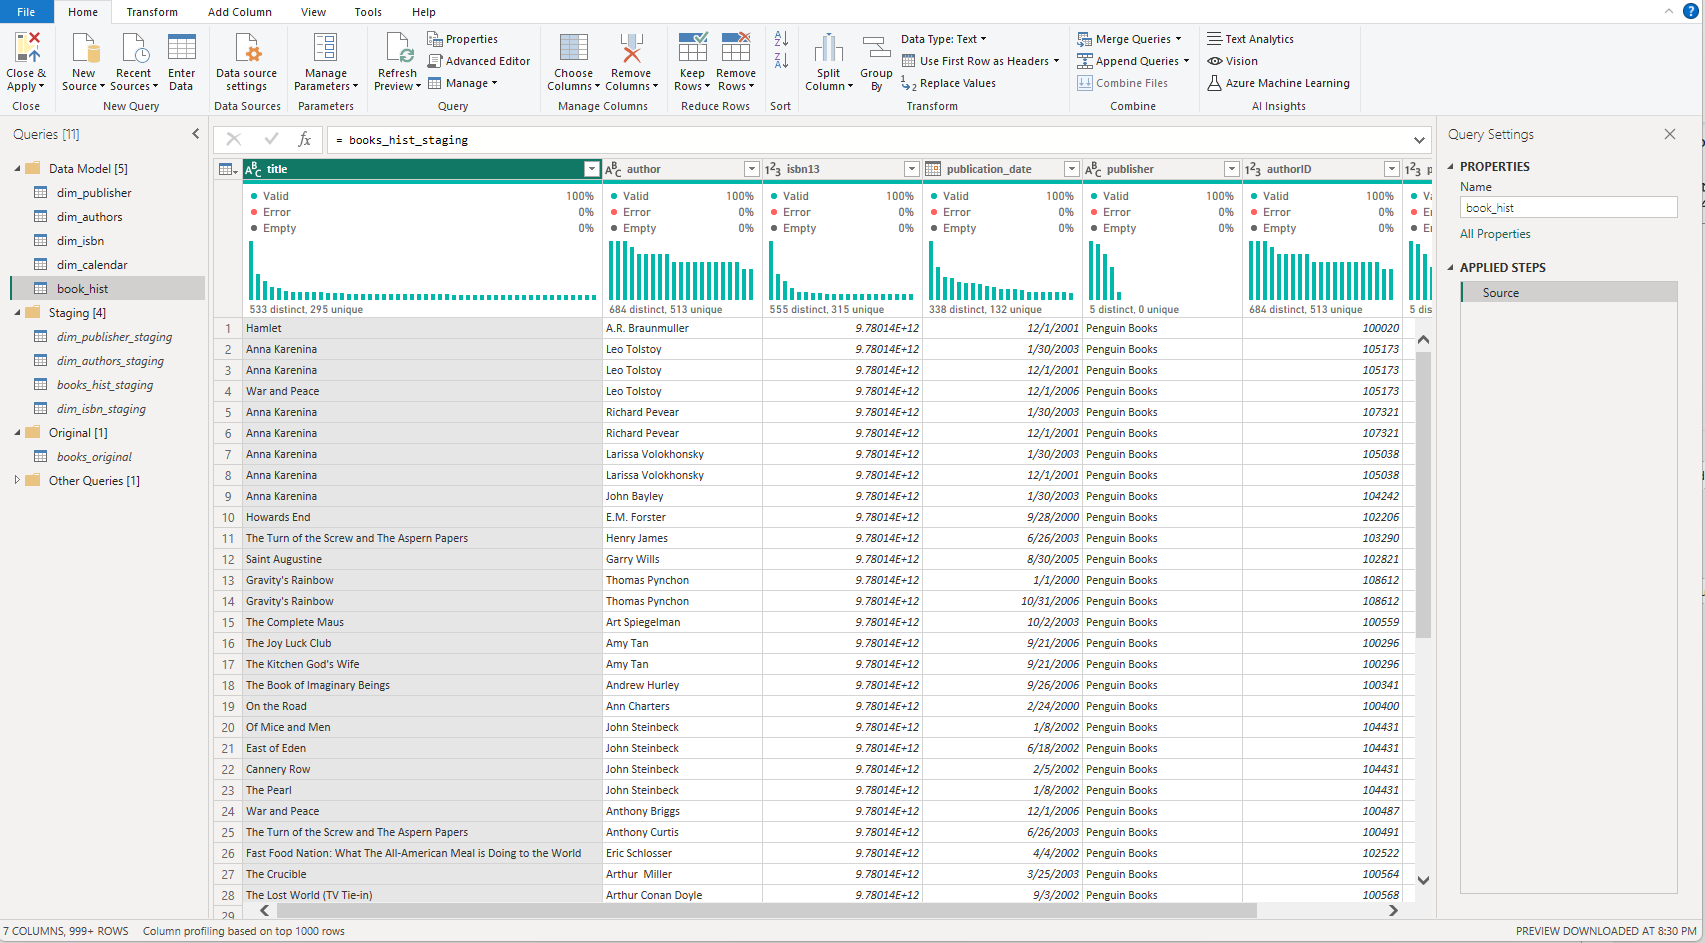
And here’s your dataset:

Data Modeling Workout 005 - Books.csv (1.5 MB)

I will post my solution, next Sunday, May 14. Please be sure to hide or blur your results when you post your solution. Good luck!

3 Likes

@BrianJ,

This is the replicated main display:

Data model

And this is the basic approach to handling slicer sync:

And the PQ:
image

That was a helpful excercise!

3 Likes

Hi @BrianJ. Here is my attempt.

This is my very first submission, and I have to mention that I am relatively new to Power BI and am still learning it. So if there are any corrections to be made, kindly let me know.

Cheers,
Jassim

Queries Pane

Queries pane

Data Model

Report

PBIX file

Data Modelling Workout 05 - Submission.pbix (926.4 KB)

2 Likes

Thank you for the workout @BrianJ.

Please see my solutions below:

Query Pane

Data Modeling Workout 5_Query Pane Page

Data Model

Replica of the report page:

1 Like

Below are my submission for this workout;

Data Model

Summary

Query Pane

Summary

1 Like

Here is my solution.
005 GIF

I could not get Slicer Author to filter Slicer Title. I look forward to see the solution.

Power Query Editor

Model View

Report View

1 Like

For some reason I started this challenge off looking to add a bridge table, then I was like I can probably make it easier than. I come across many to many situations all of the time. I realize that as the number of fields increase, so does the complexity with this challenge. At work, almost every fact & dimension table has over 80 columns.

For all of my experts out there, is it normal for your DB team to create dimensions with so many fields?


1 Like

Thanks for another great workout. Below are my results

Power Query

Data Model

1 Like

First off, great job by everyone who participated in this week’s Data Modeling workout!

Always fascinating to see how people attack a problem in PowerBI in different ways, whether that be a DAX problem, M coding challenge, or a data modeling issue like this one.

The one clearly wrong way to address the many-to-many relationship between author and books (i.e., a book can have multiple authors and each author could write multiple books) would be just to connect the Authors and Books tables with a bidirectional relationship. This sort of structure can lead to ambiguous paths, which in turn can undermine the accuracy and validity of your DAX calculations.

The way that all this week’s submitters chose to address the problem was via a very standard star schema structure, and then addressed the slicer syncing issue via measures and entries in the filter pane. This has the advantages of being quite simple to implement, and consistent with our general approach of relying on that standard star schema where possible.

However, I wanted to introduce an alternative approach that @Hakeem mentioned - the use of a bridge table. This is an intermediate table that sits in the middle of the many-to-many relationship and breaks it down in separate many-to-one relationships. It does so by capturing all of the key field combinations tables - in this case, authorID and isbn13.

Because relationships in Power BI can only connect based on a single field, we now have to develop a new key called BookAuthorKey that is a composite of the authorID and isbn13 keys and uniquely identifies every pair of author and book keys.

Then to connect the bridge table to the Books table, we have to recreate the same key in that table, which in this case I did via M code, but you could also push that action further upstream to SQL/Data Warehouse if that option is available to you.

Once you’ve created and connected the bridge table, you don’t need to create any additional measures or filter pane enteries to make the synch slicers work.

As you can see above, my Filter pane is clear - the data model carries the load for synching the slicers.

So, which approach is best?

As is almost always the case with Power BI, the correct answer is “it depends”.

The bridge table version of the report likely will perform better at large scale (i.e., millions of rows or more), since it won’t require calculating and recalculating measures across a large fact table in real-time.

In addition it has some advantages in terms of documentation. Most automated documentation software (e.g., DataMarc Documenter, Monkey Tools, etc.) will explicitly document your model relationships in detail, but not your filter pane contents. Thus, unless you take the additional steps to document this yourself, someone reviewing your documentation won’t be able to say for certain how you synched the slicers.

Conversely, as I mentioned before the “standard” start schema approach also has some advantage to recommend it, so you will need to evaluate “best” relative to your specific use case.

But the bridge table approach is definitely a good weapon to add to your data modeling arsenal.

I hope you found this exercise helpful.

We’ll be back tomorrow with Part II of our many-to-many relationship series - this time looking at a different type of M:M problem in our bookstore, again with multiple solution approached. Hope to see you there…

  • Brian

Data Modeling 005 - Brian Julius Solution.pbix (1.5 MB)

8 Likes

Hi All,

Please find details of my solution to this workout:

I implemented the same steps and good practices learned on previous Data Model Workouts:

  1. Connect Data, name it as Raw… and Move it to a New Group “Staging Queries”. Disable load.
    One useful tip, to been able to used my PBIX without erros, is that I connect to Data with Web Connector:
    let
    Source = Csv.Document(Web.Contents(“https://forum.enterprisedna.co/uploads/short-url/bSPy1kRa6087P99GQBOoVYe9t3N.csv"),[Delimiter=",”, Columns=7, Encoding=65001, QuoteStyle=QuoteStyle.None]),

  2. Create reference to this table and create the dimension and fact tables.
    BooksAuthors I decided to create a Dimension with Book and Authors, and create a Key with isbn13-AuthorID
    Books Added a custom column to create an ID with Book-Author. Removed columns: title, author and publisher
    Publishers Dimension with Publisher and publisherID
    Moved this tables to a Group “Data Model”

  3. Create Dates tables from eDNA Extended Dates Tables and move to New Group “Functions”. Invoke function and move table to “Data Model”. Create parameters Start Date and End Date, based on publication_date and move to New Group “Parameters”. Added parameters to Dates Table created.

Data Model

image

PBIX

Data Modelling Workout 05 - Many-to-Many (Part I) - Santiago Cancela Solution.pbix (1.2 MB)

@BrianJ

Good day! Just want to get your input on 2 things that I’m stuck with:

  1. Why am I unable to make title and author filter or reduce selection when selecting 1 or the other
  2. For the card list of authors selected how do I make the result into a drop down list instead of a long list?
    Data Modeling 005 - Kenneth Tancinco.pbix (843.3 KB)

Thanks!