There are many best practices for data modelling in Power BI, and this workout concentrates on a few “infrastructure” ones, namely staging, referencing, linking via key columns, and hiding unnecessary columns.
Goals
• load the raw data once (staging) and use it many times (referencing)
• create a star schema data model from the referenced tables using only key columns for linking
• hide unnecessary columns from the report consumers
Tasks
Produce a Power BI file in which you:
• create fact and dimension tables from the flat-file sales data provided
• create a [Dates] table from the Enterprise DNA Extended Date Table (Power Query M function)
• create a [Key Measures] table to house the DAX measures created from the DAX data provided
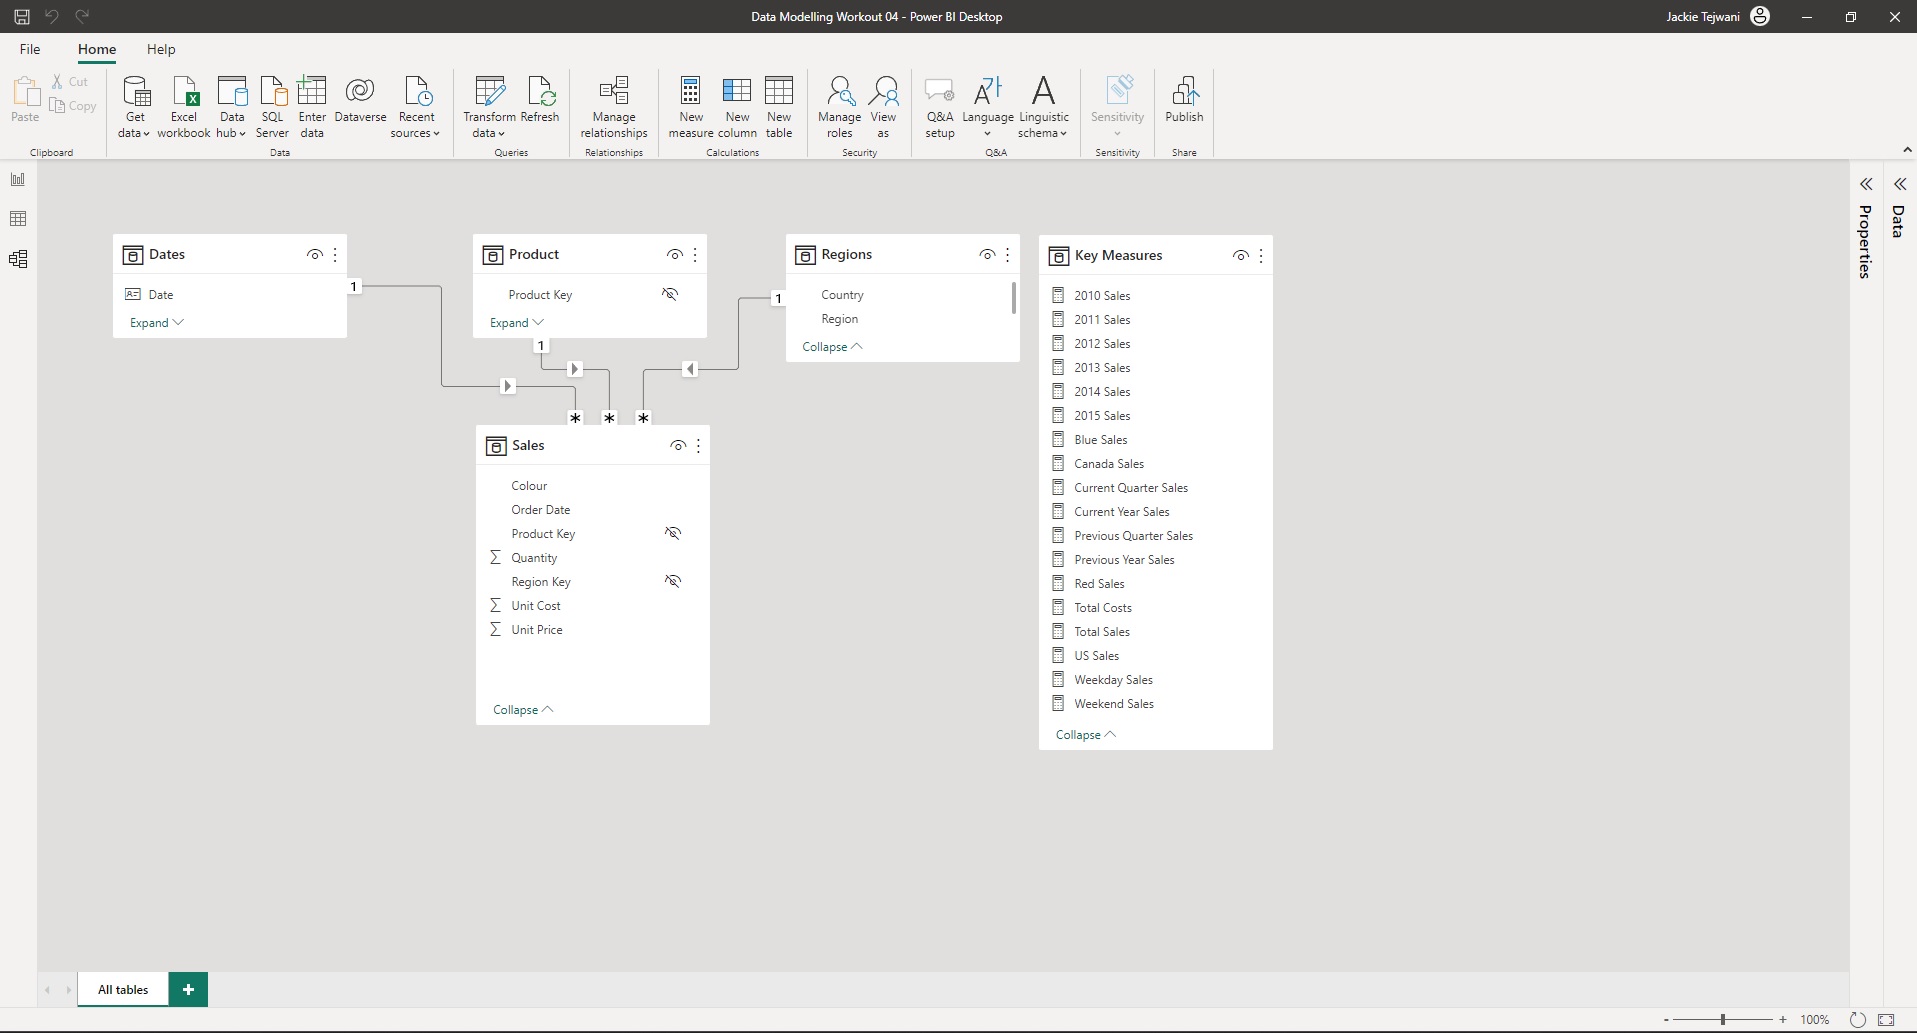
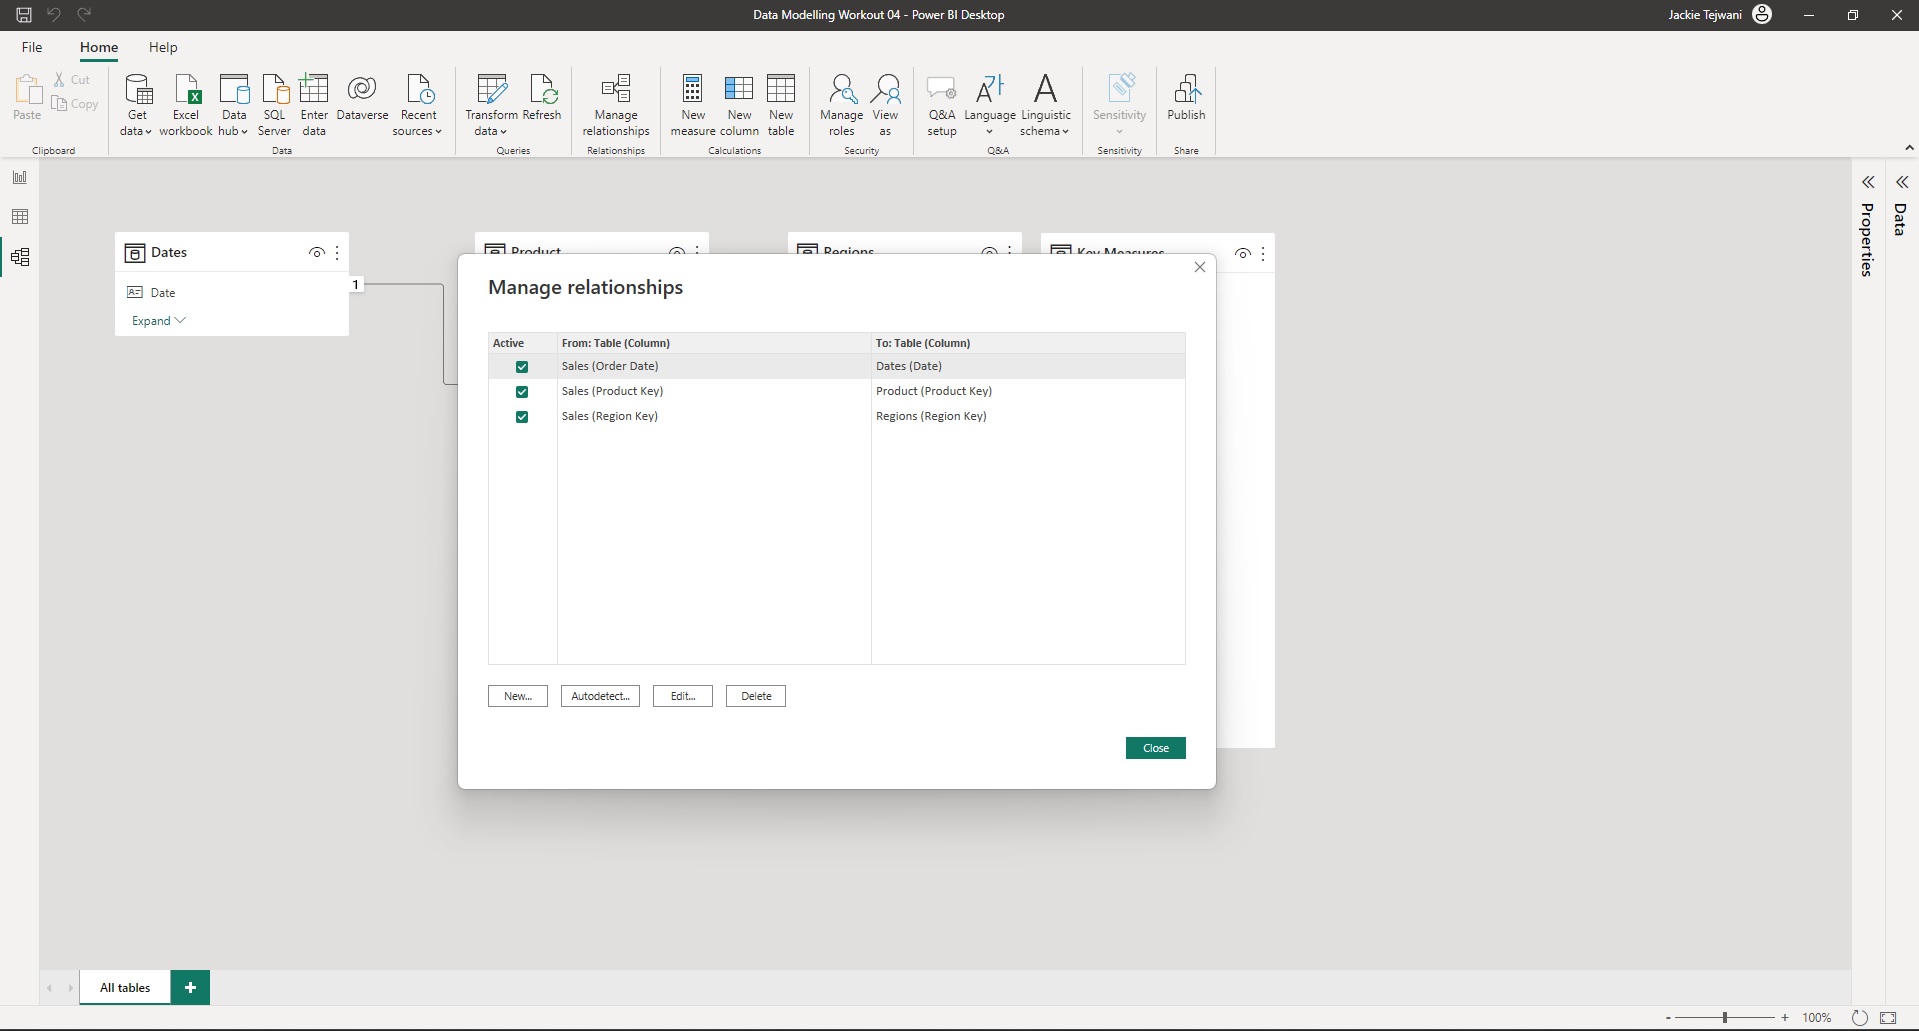
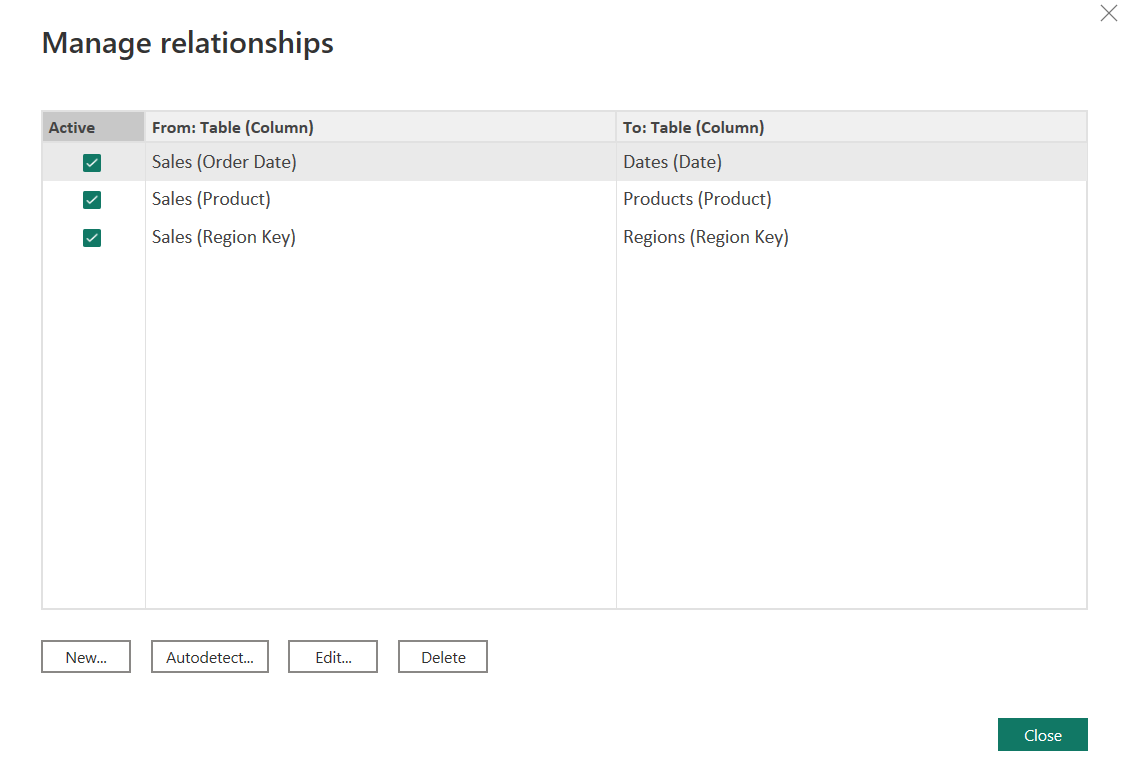
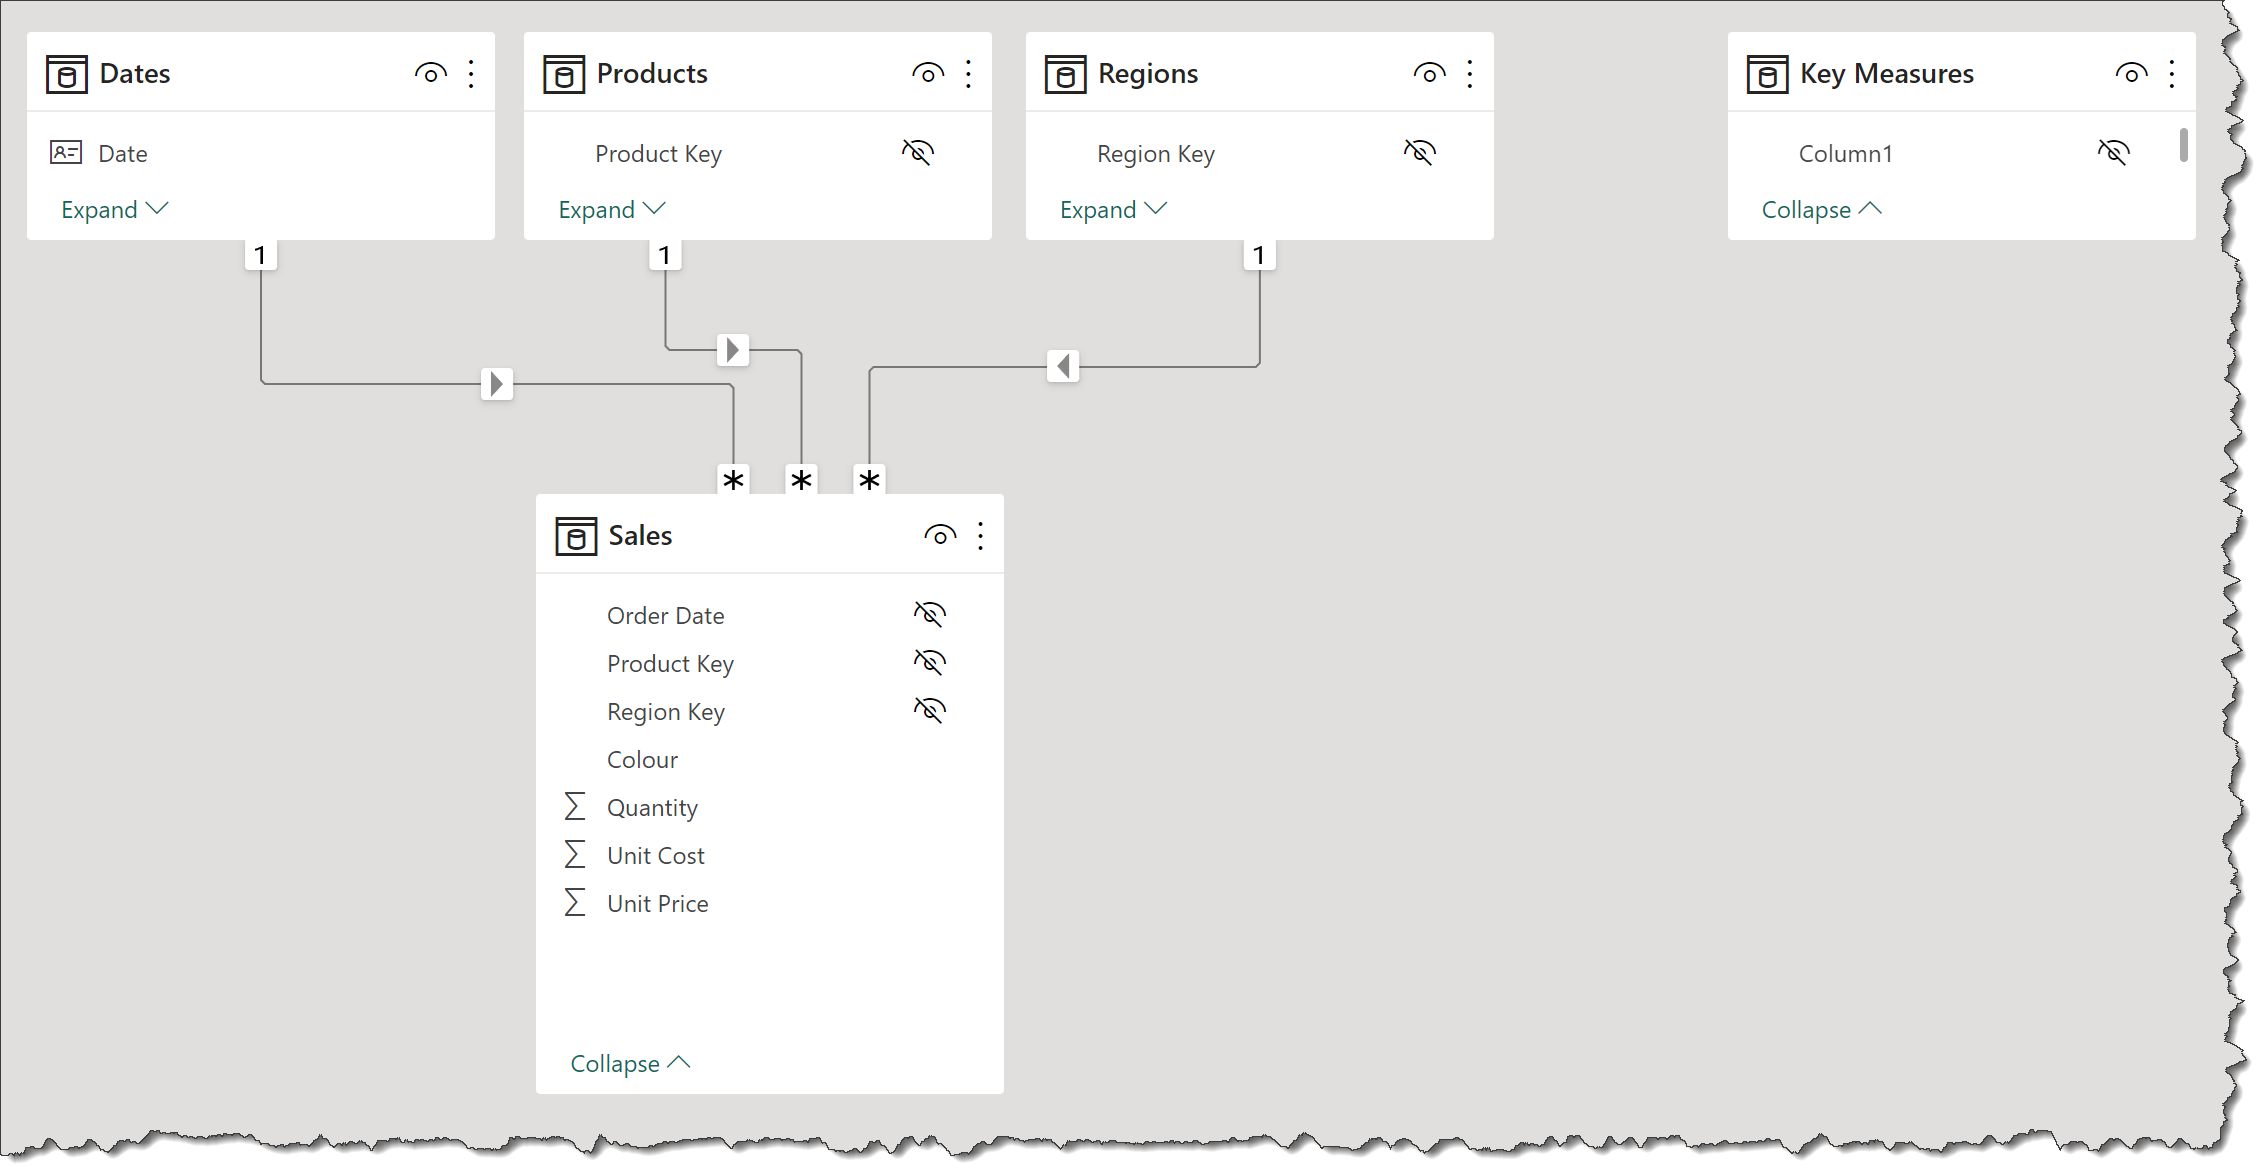
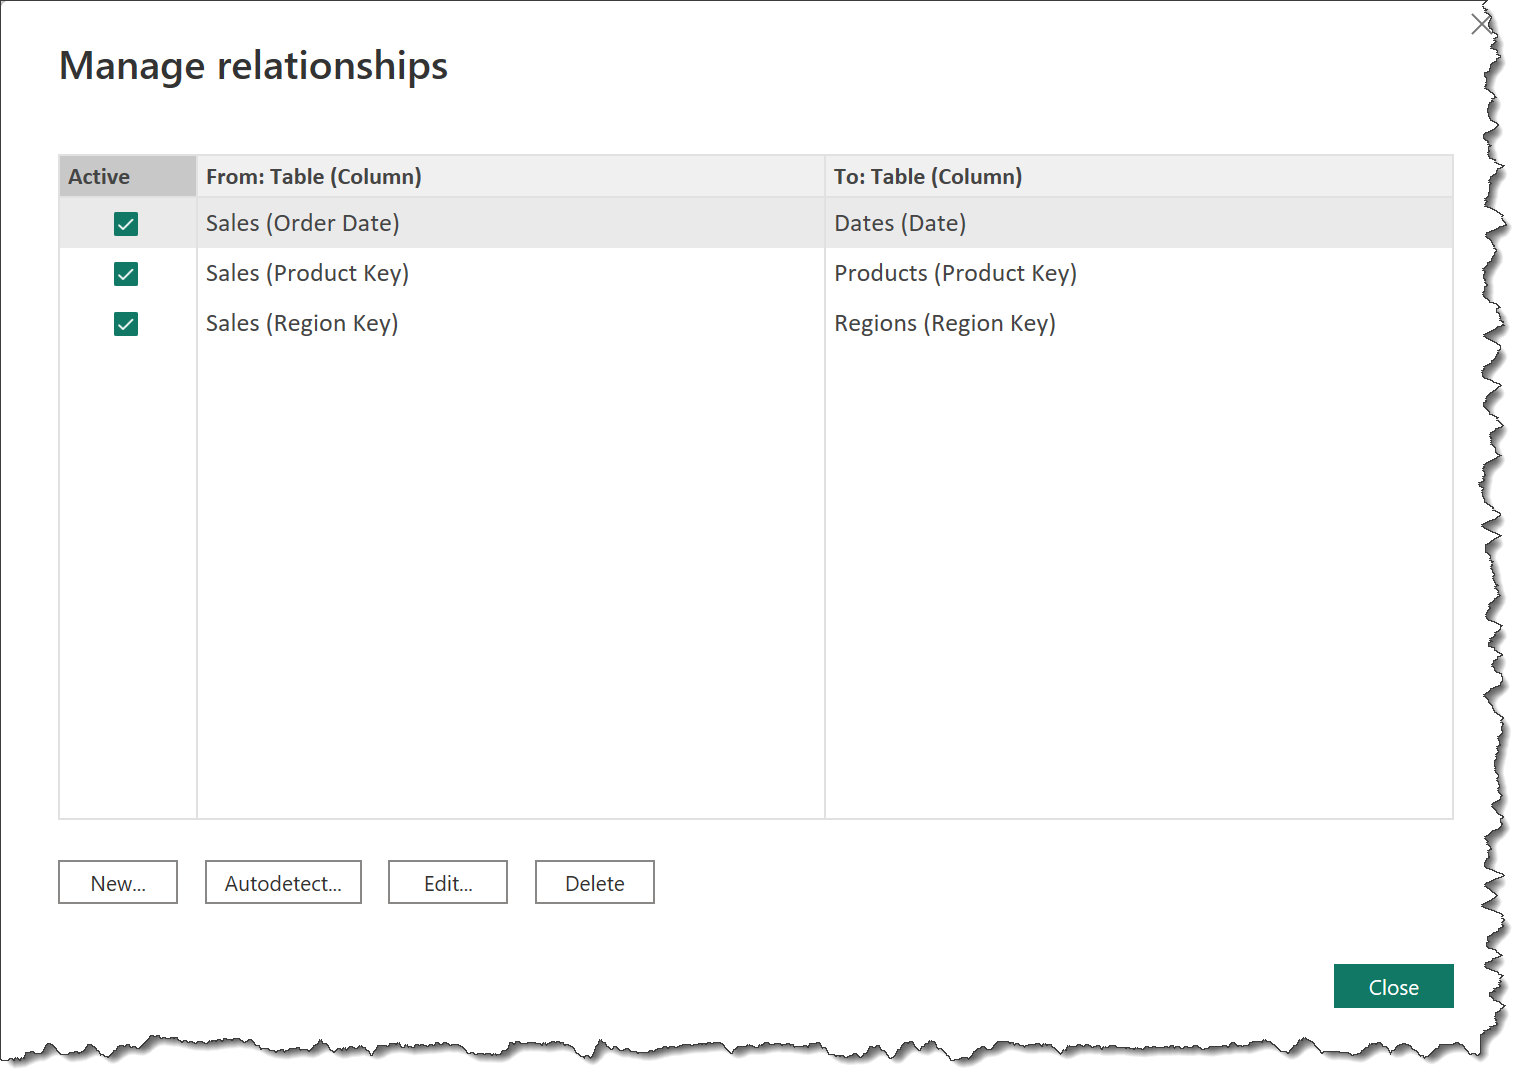
• link the various tables into a full star schema using key columns, 1-to-many relationships, and single direction relationships only, and arrange in a waterfall layout
• simplify the report consumption experience by hiding all linking columns
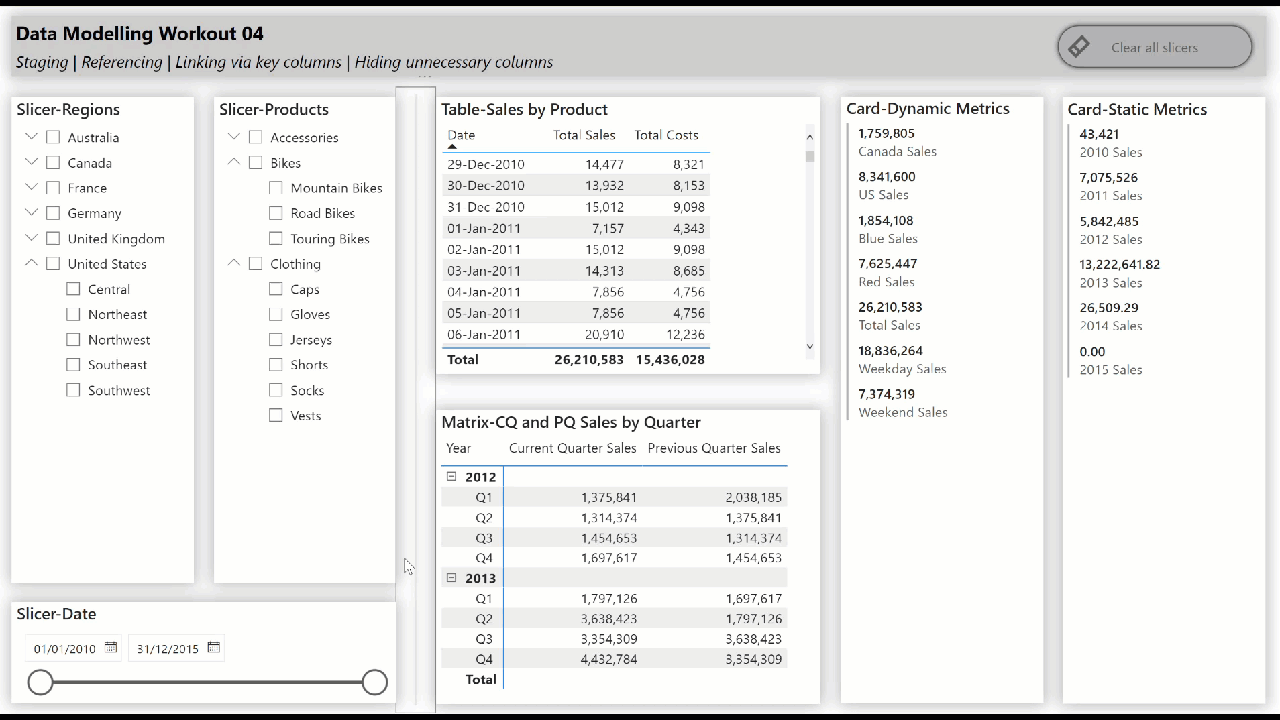
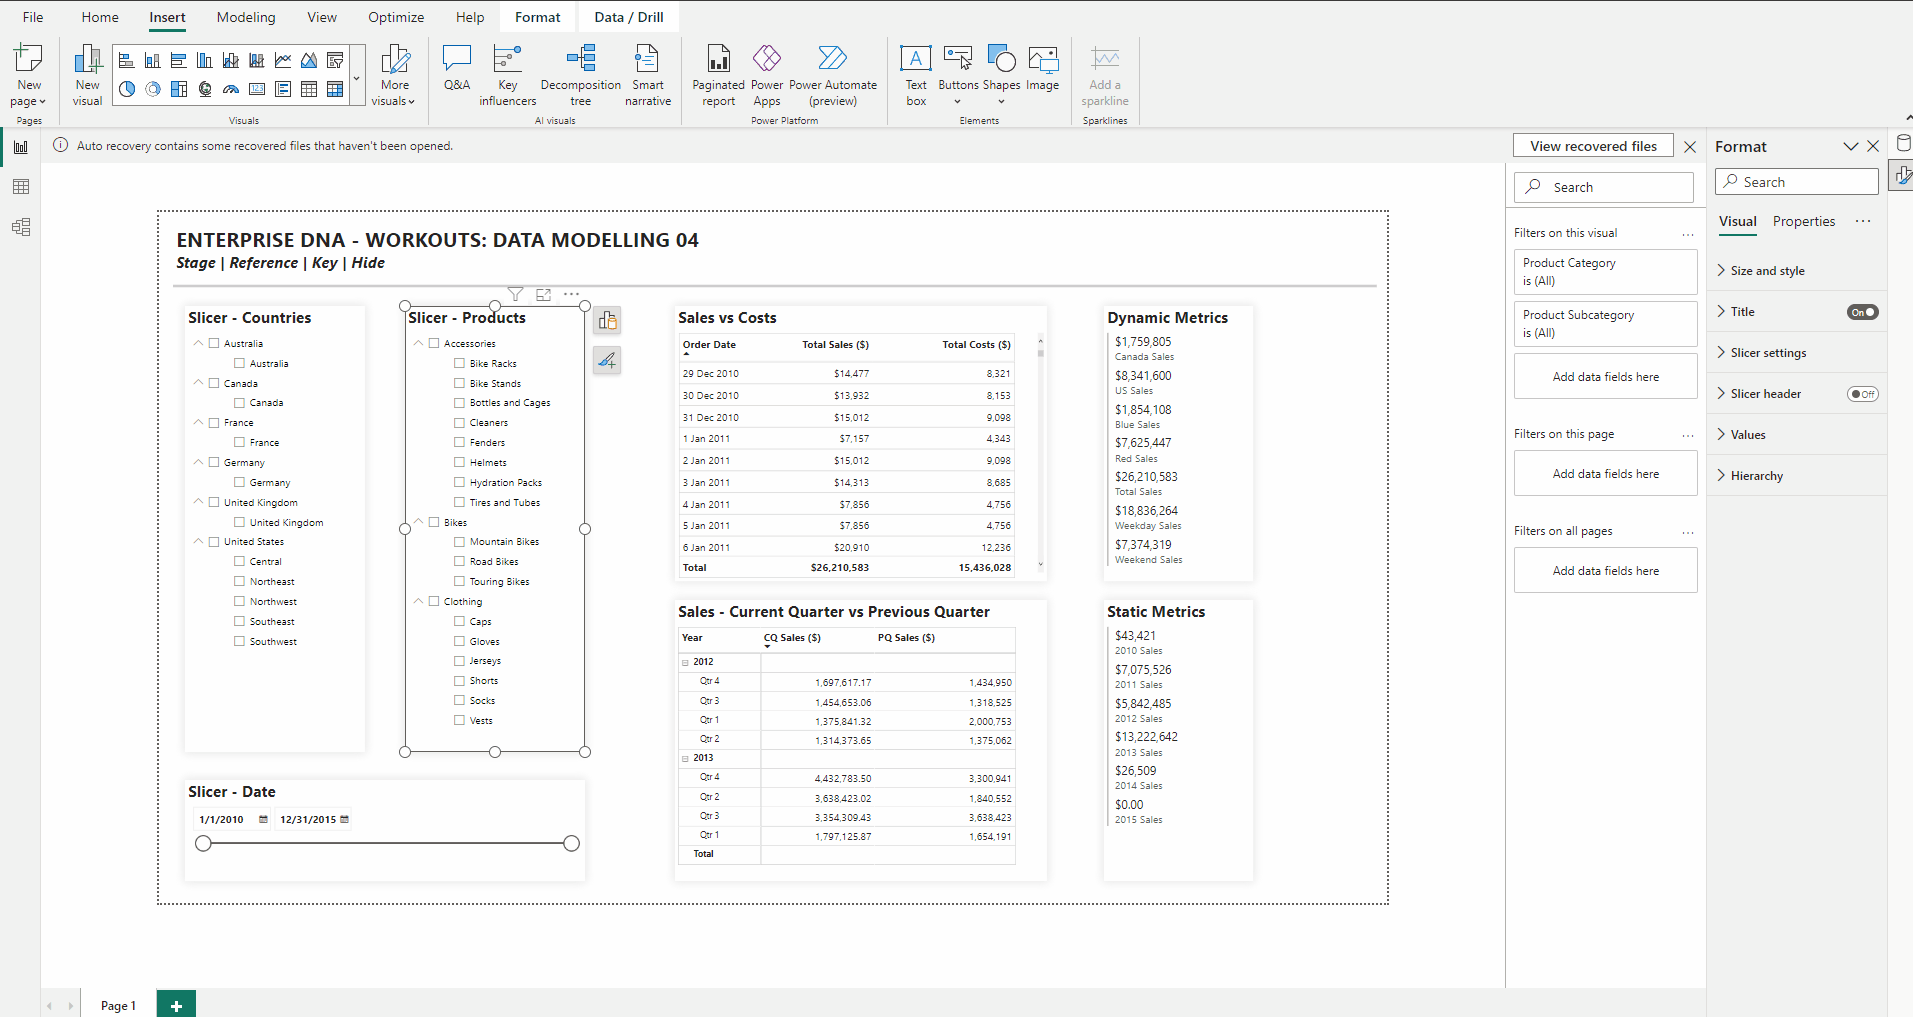
• include slicers, tables, matrices, and cards to showcase the star schema data model “in action” (i.e., while making slicer selections)
Notes
• use only the DAX code provided; do not modify nor create additional measures or calculated columns
• (data source: a 50,000 row subset of the Microsoft [AdventureWorksDW2019] sample database)
Submission
Using the only the data and DAX files provided, create your solution, and reply to this post. Upload the following:
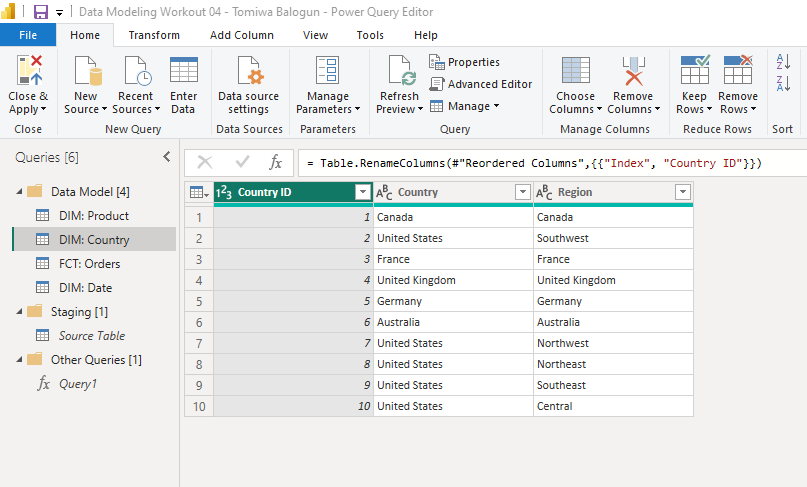
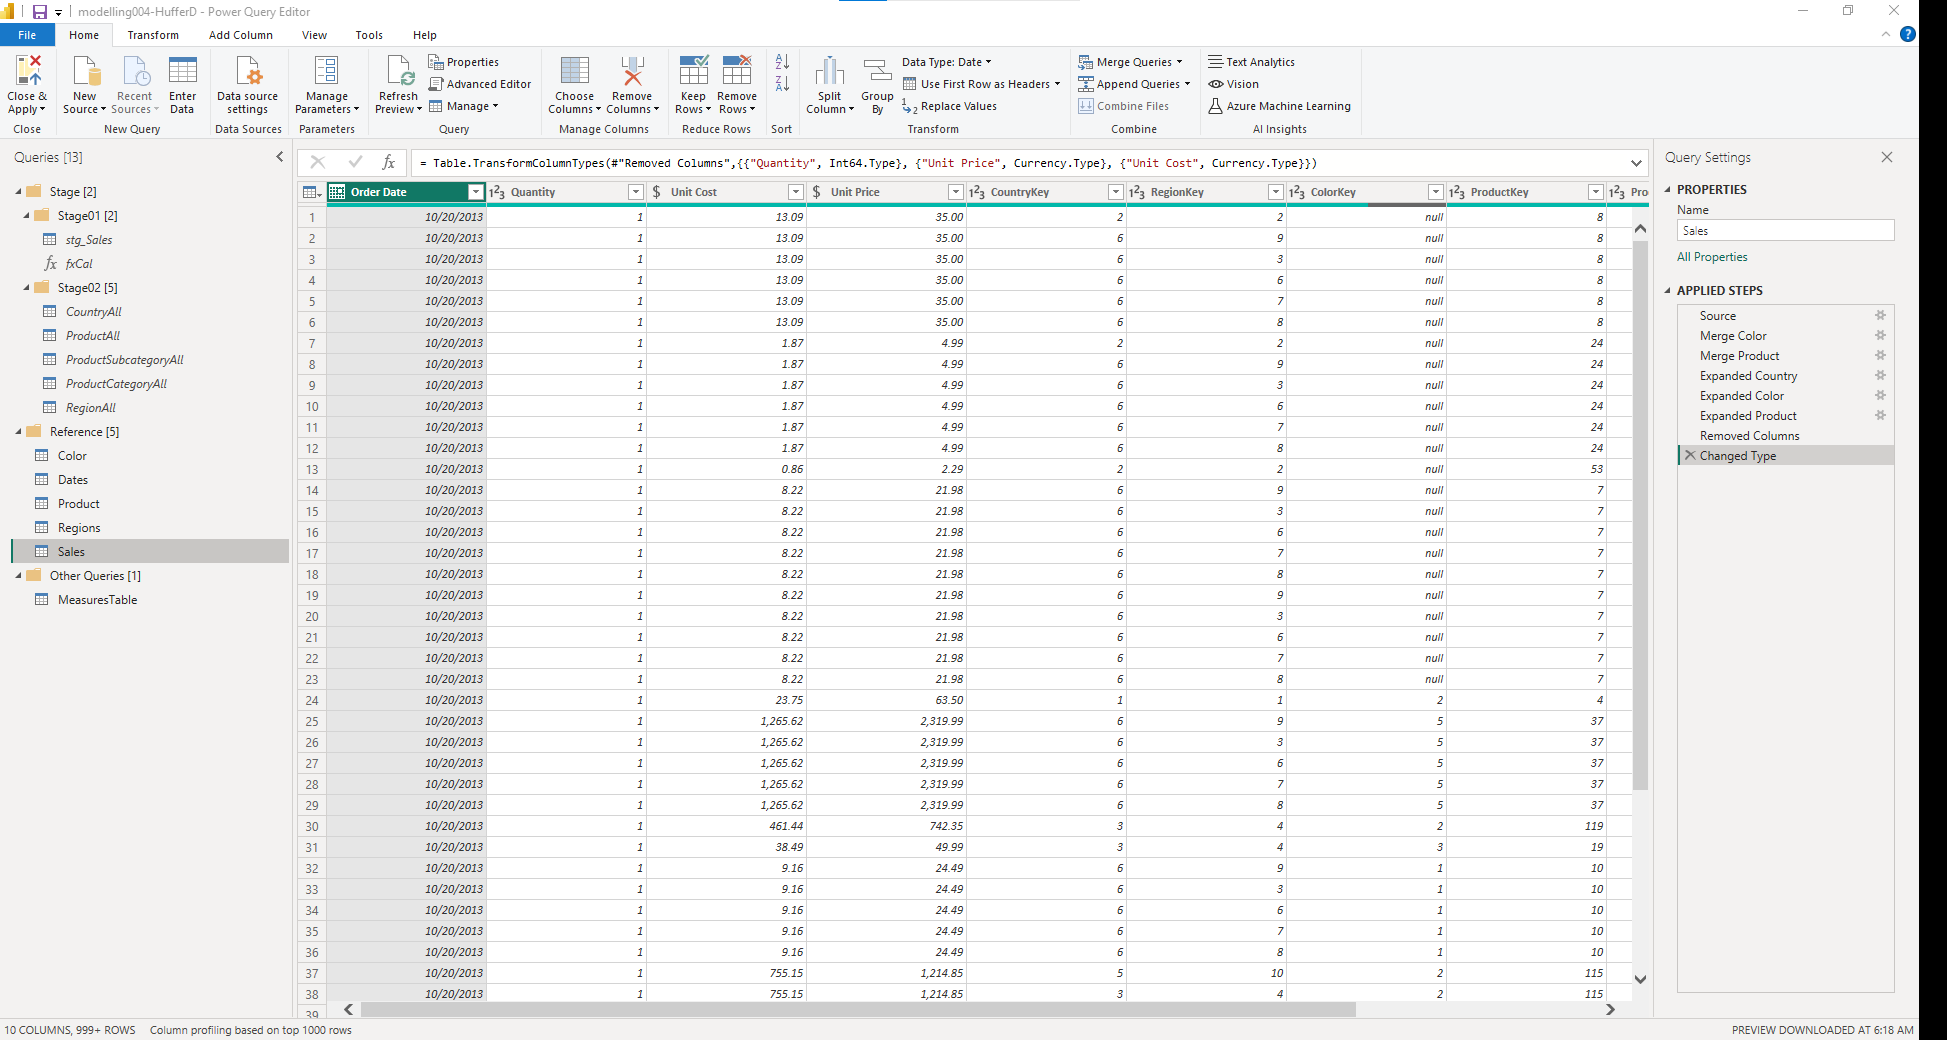
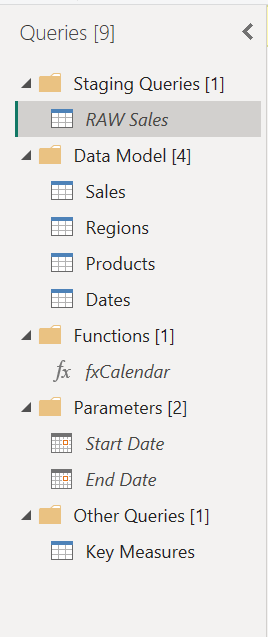
• a screenshot of the queries pane of the [Power Query Editor] with all groups expanded
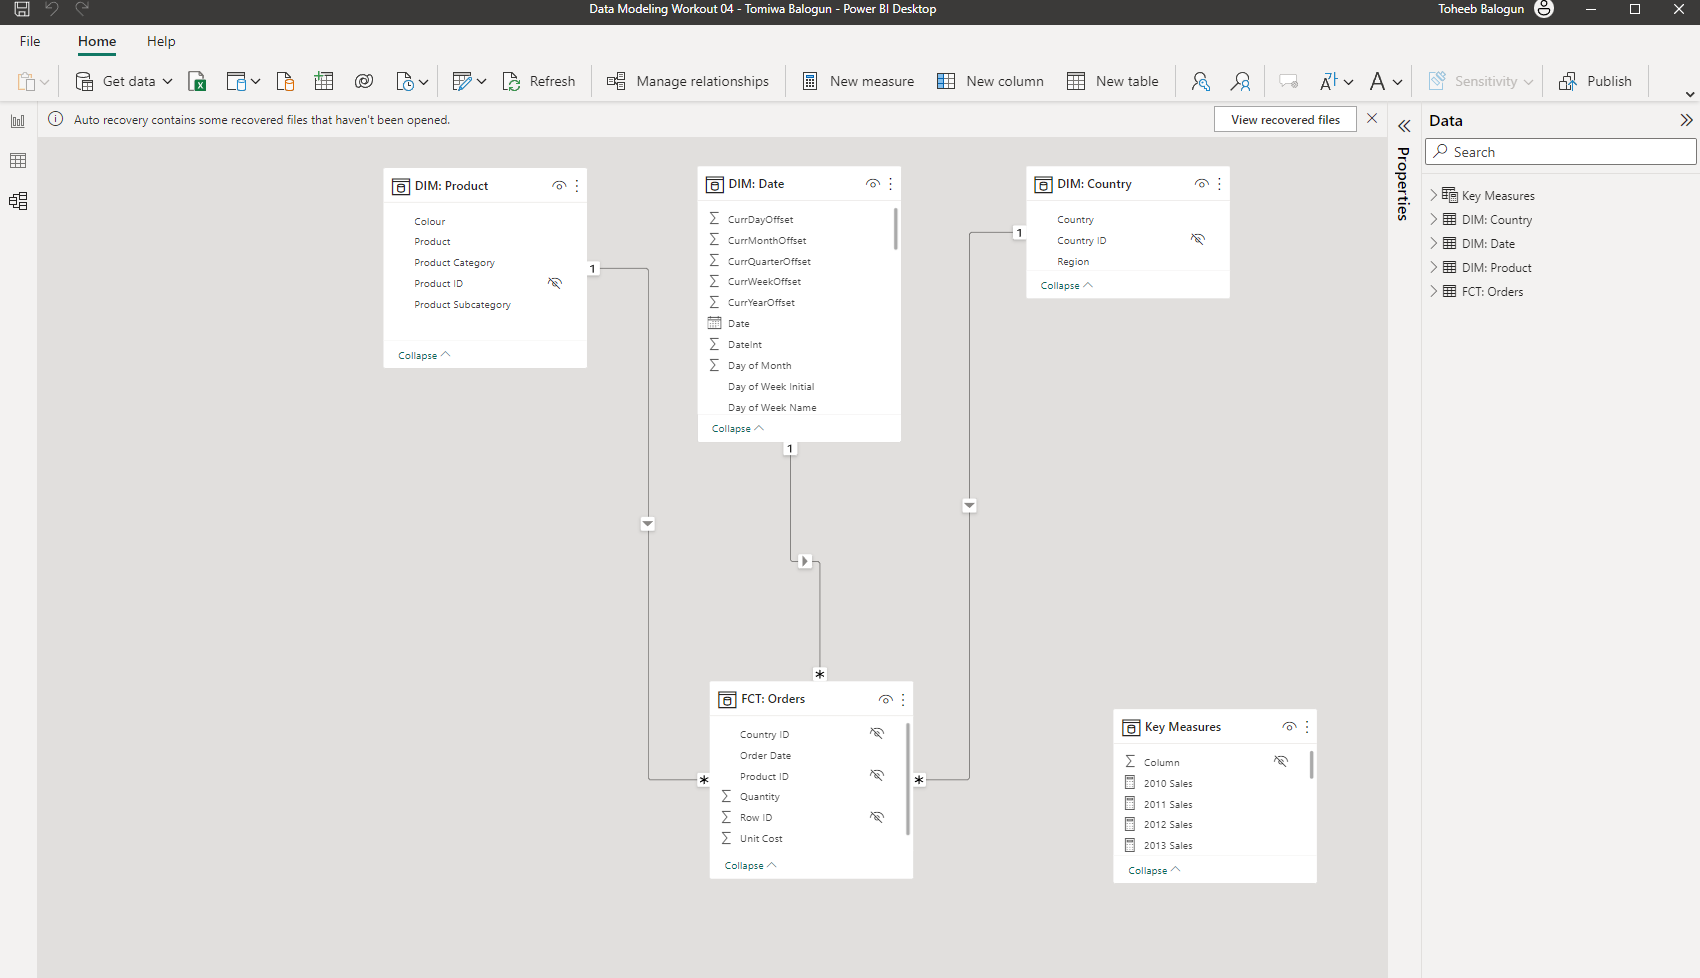
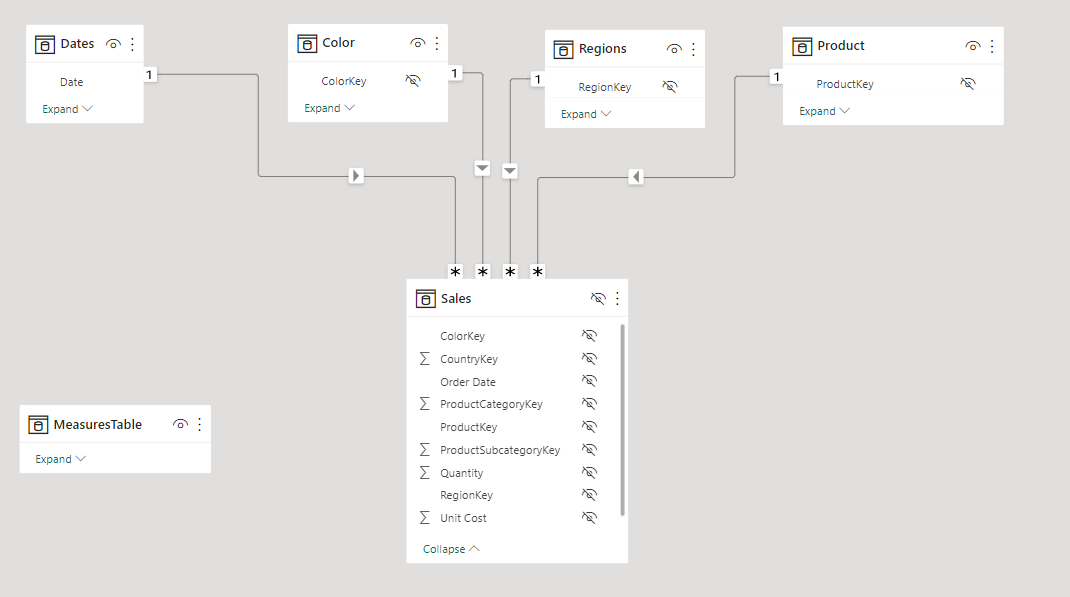
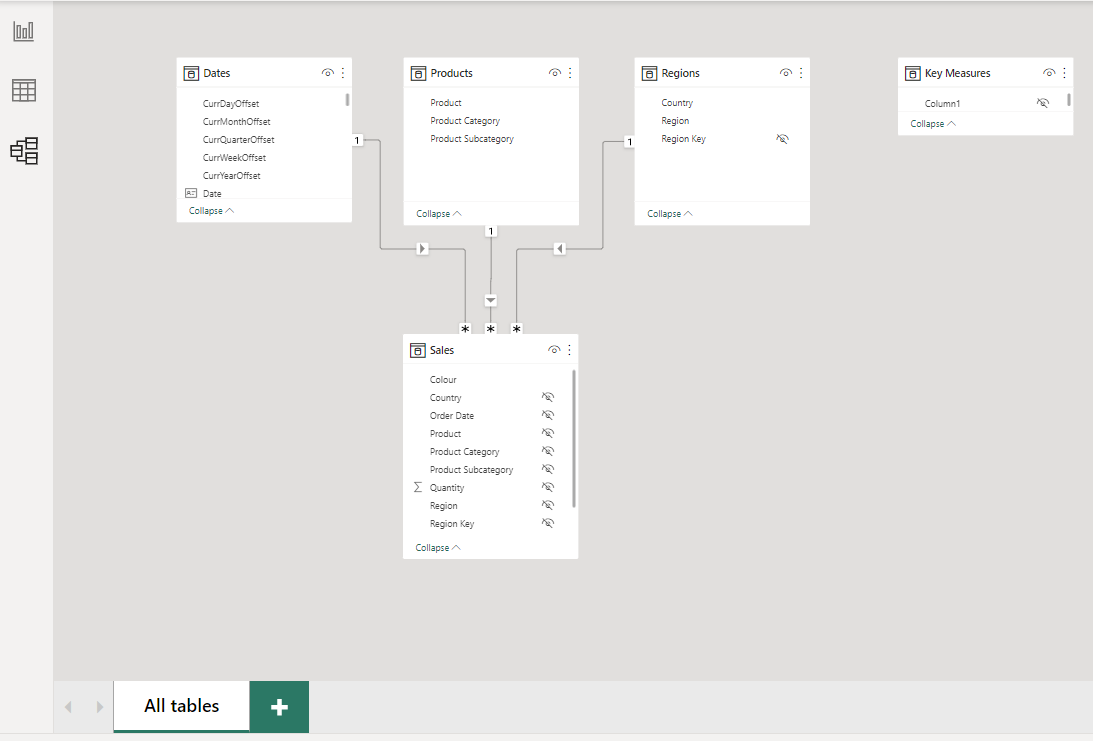
• a screenshot of the data model as displayed in the [Model View]
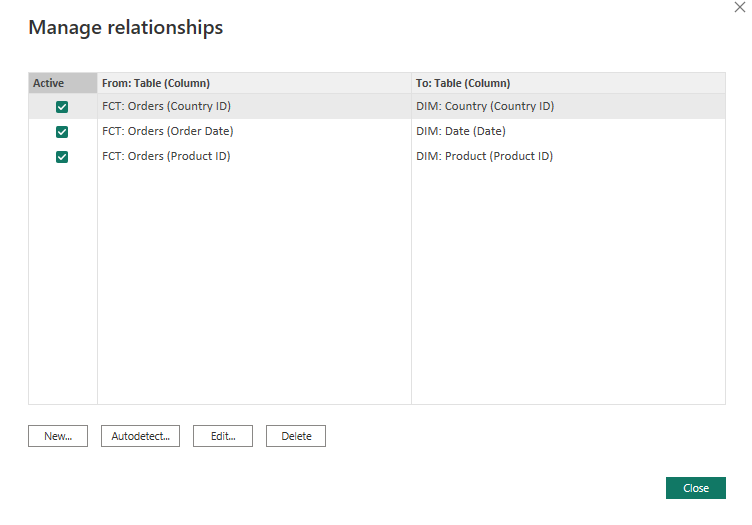
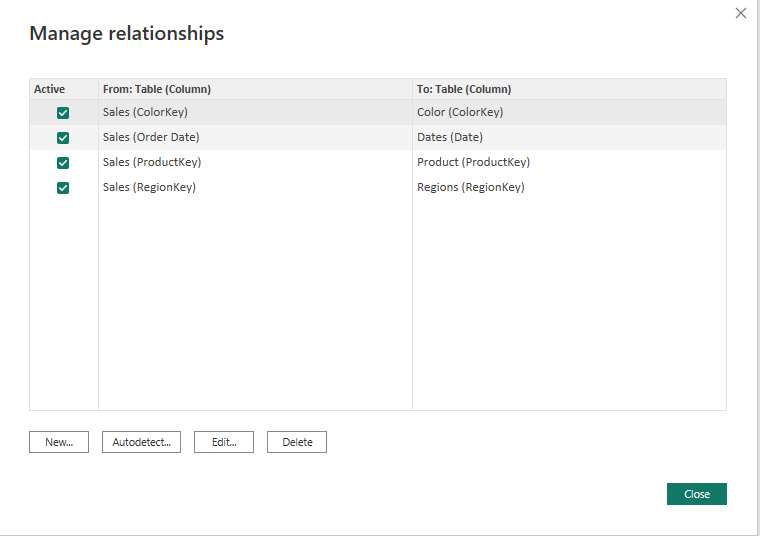
• a screenshot of the [Manage Relationships] dialog
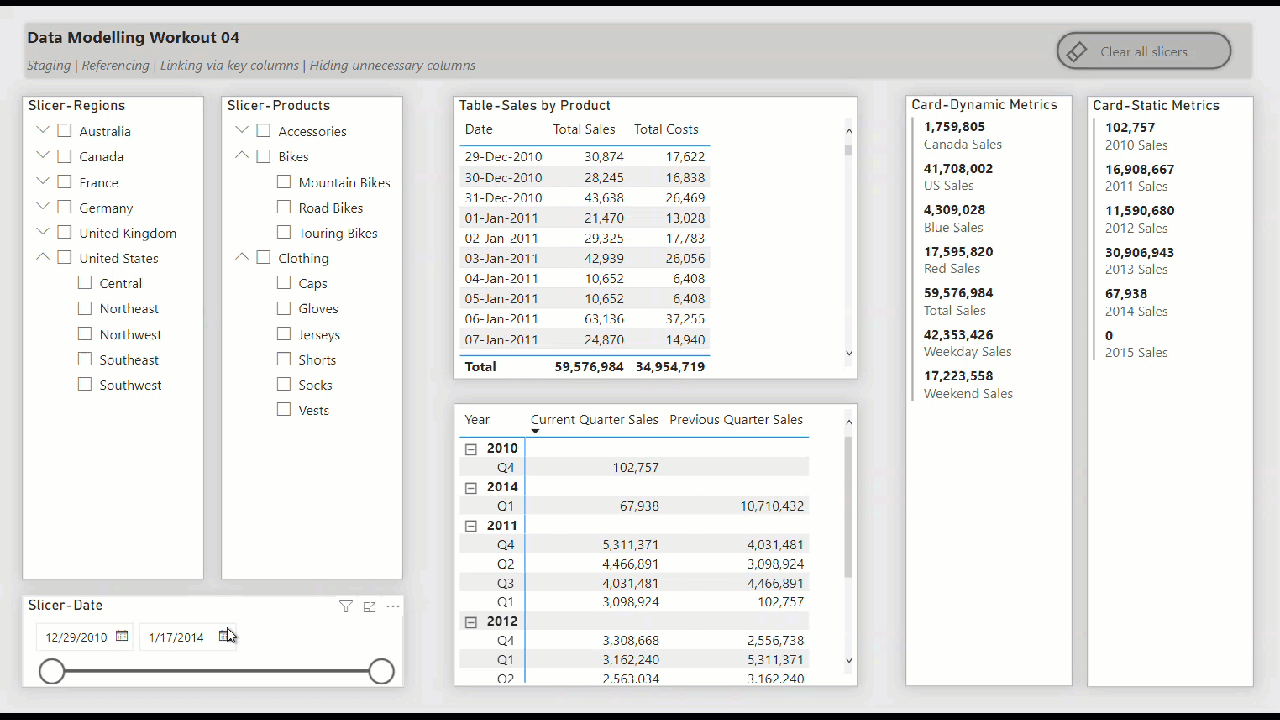
• an animated GIF of your Power BI file “in action” (i.e., while making slicer selections)
• your PBIX file
Please blur your screenshots and GIFs or place them in a hidden section.
(While this workout builds upon the skills inherent in the first 2 workouts, it is recommended that respondents do not use previous workouts as starting points, but rather start a new file from scratch. While this may involve some repetition, that is actually the point, as it serves to reinforce the tasks/activities inherent in a good data model; practice makes …)
Period
This workout will be released on Monday May 1, 2023, and the author’s solution will be posted on Sunday May 7, 2023.
@Greg Thank you for this workout. I’m not sure if asking questions is allowed before the deadline but I’ll try anyways.
When you say hide unnecessary columns, I’m assuming that you’re referring to the key columns. This is relatively new to me because none of the senior devs I work with do this.
If I bring in a table from the DW and it comes with a natural key and surrogate key, should I hide both?
Hi @Hakeem. Of course asking questions is allowed … in fact, asking questions is encouraged, as the whole purpose of the workouts is to practice and learn. So, on to the issue:
For each organization/report, the term “unnecessary” will to an extent depend on the audience. Regardless, there’s a few rules I follow (I’m sure there are more, but this is a start):
hide all key columns used for linking (both in the fact and dimension tables)
hide all columns that are presented by measures (e.g., hide the Sales[Line Total] column when you (the developer) want the report consumers to use the [Total Sales] measure instead, etc.)
hide all values in the fact table that should instead be added from the dimension tables (e.g., hide the Sales[Product] column, leaving only the Products[Product] column for the report consumers, etc.)
hide all values in the fact table that will not be used by the report (e.g…, surrogate keys, order numbers, etc.)
@Greg Thank you for this workout. This is my first time performing the staging task inside of Power BI, and I must confess, it was a smooth learning experience. I have a question, is it always ideal to stage big data inside of Power BI? Or perform the staging tasks on other ETL tools and load them to Power BI afterward?
I use staging and referencing almost exclusively … for me, some of the main benefits include:
isolates the credentials used to access the data source (this is by far the leading cause I’ve found for data refresh errors)
minimizes the strain on the data source (takes only the absolute minimum time as there are no transformations)
(in fact, if the data is dirty, I often use a second level of staging where I do column renaming, column typing, and replacing of values and errors)
enables easy re-use of “flat-file” data with only a single import
So, while yes, staging-and-referencing is a little more work at design time, the troubleshooting and clarity benefits (to me) are clear. The definition of “big data” also varies by the customers’ infrastructure, and thus should be evaluated on a case-by-case basis, but I’ve very rarely found instances where the performance penalty is a factor.
Thank you @Eze
It was my first time trying out the recording software as well. You can download it from screentogif.com.
You have three download options on the website - Package or Installer or Portable. I downloaded the package as it appear to be the complete package of the software.
Here’s the notes I kept during the development of my solution to this workout.
Pre-Modelling Activities - General/Options:
• create new, empty PBIX
• use File\Options\Options and settings\Global\Data Load\Time intelligence to ensure Auto Date/time for new files is disabled
• use File\Options\Options and settings\Current File\Data Load\Time intelligence to ensure Auto Date/time is disabled
• use File\Options\Options and settings\Current File\Data Load\Relationships to ensure Autodetect new relationships after data is loaded is disabled
• use File\Options\Options and settings\Current File\Data Load\Relationships to ensure Import relationships from data sources on first load is disabled
• use [Enter data] to create an empty [Key Measures] table; create a placeholder measure (say, m1 = 1); right-click on [Column1] and select [Hide]
• use Query Editor in Power BI Desktop to do the following:
• create a new blank query, paste the M code (as copied above), rename the blank query to [fxDatesQuery]
• move [fxDatesQuery] into a new group [Functions]
• create a new blank query for a parameter to hold the earliest fact table data date (use placeholder date of, say, 2020-01-01); rename the blank query to [pStartDataDate]
• create a new blank query for a parameter to hold the latest fact table data date (use placeholder date of, say, 2020-12-31); rename the blank query to [pEndDataDate]
• create a new blank query for a parameter to hold January 1st of the year of the earliest fact table data date; rename the blank query to [pStartDate]
• create a new blank query for a parameter to hold December 31st of the year of the latest fact table data date (add 1 year to ensure DAX code that uses time intelligence functions operates properly); rename the blank query to [pEndDate]
• move the [pStartDataDate], [pEndDataDate], [pStartDate], and [pEndDate] parameters into a new group [Parameters]
• modify the code of the [fxDatesQuery] function to use the [pStartDate] and [pEndDate] parameters
Pre-Modelling Activities - Data Loading:
• load raw sales data from [Sales] tab of the Data Excel file; rename query to [RAW Sales]; deselect “Enable Load”; move into a new group [Staging Queries]
• modify the placeholder dates in the [pStartDate] and [pEndDate] parameters to use the earliest and lates [Order Date] of the [Sales] table
• use the [fxDatesQuery] function to create a new table; rename the resultant table to [Dates];
• move the [Dates] table into a new group [Data Model]
• mark [Dates] table as a date table
Modelling Activities - Power Query: [Regions] table:
• create reference of [RAW Sales]; rename as [Regions]; move into [Data Model] group
• use [Choose columns] to keep only [Country] and [Region] columns; select both columns, then right-click and select [Remove duplicates]
• (totally optional, but I usually do it) choose each column in turn and select [Sort Ascending] from the drop-down arrow (I used hierarchical order, so [Region] first, then [Country])
• use [Index Column (From 1)] to add a key column; rename to [Region Key]; re-order to first column
[Products] table:
• create reference of [RAW Sales]; rename as [Products]; move into [Data Model] group
• use [Choose columns] to keep only [Product], [Product Subcategory], and [Product Category] columns columns; select all columns, then right-click and select [Remove duplicates]
• (totally optional, but I usually do it) choose each column in turn and select [Sort Ascending] from the drop-down arrow (I used hierarchical order, so [Product Category] first, then [Product Subcategory], then [Product])
• use [Index Column (From 1)] to add a key column; rename to [Product Key]; re-order to first column
[Sales] table:
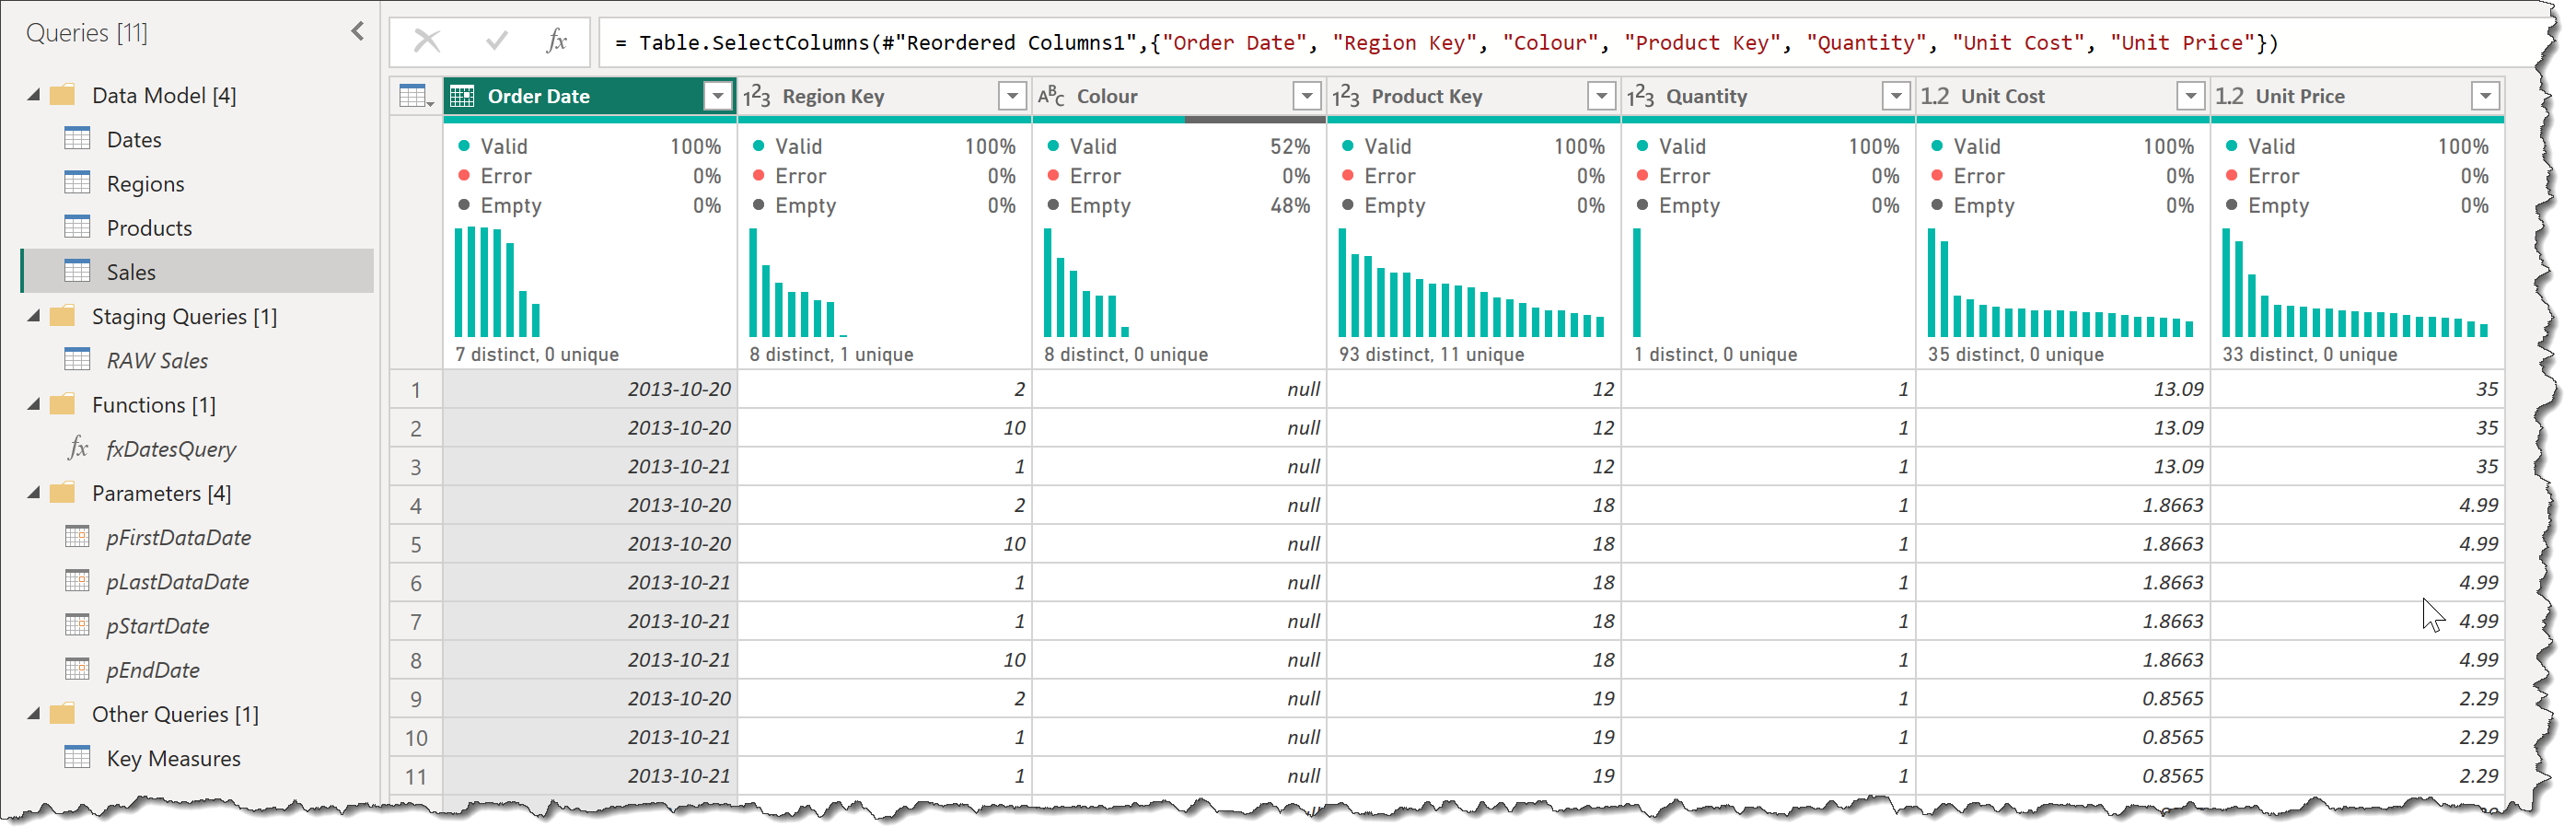
• create reference of [RAW Sales]; rename as [Sales]; move into [Data Model] group
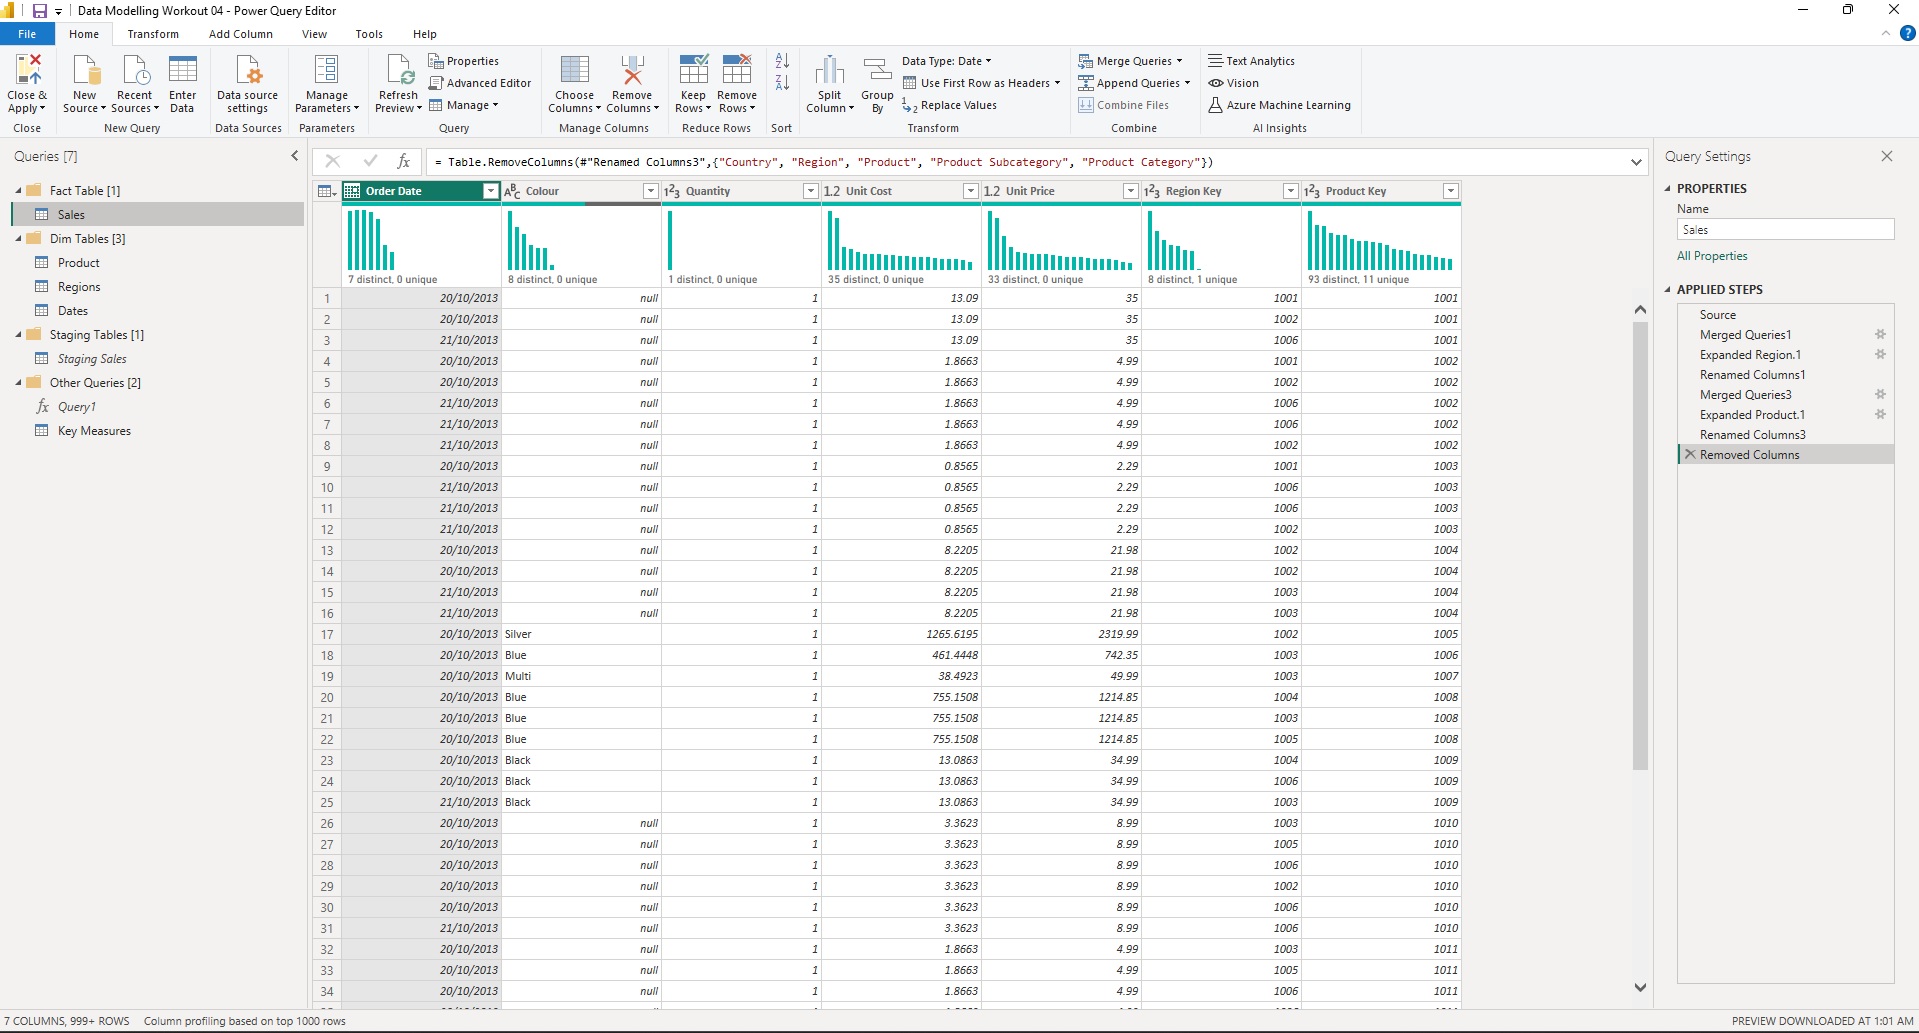
• merge with [Regions] table (linking on [Region] column); expand [Regions] column keep only [Region Key] column; reorder columns to put [Region Key] before [Country]; use [Choose Columns] and de-select [Country] and [Region] columns
• merge with [Products] table (linking on [Product] column); expand [Products] column keep only [Product Key] column; reorder columns to put [Product Key] before [Product]; use [Choose Columns] and de-select [Product], [Product Subcategory], and [Product Category] columns
• delete any relationships that may already exist (i.e., were automatically created by Power BI)
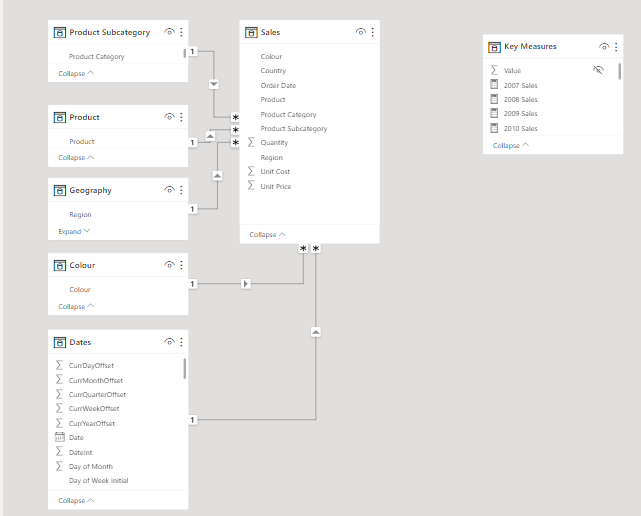
• rearrange tables into waterfall layout, so that dimension (lookup) tables are in the top row, fact tables are in the bottom row, and measure tables are in columns at the right (so [Dates], [Products], and [Regions] on top, [Sales] below, and [Key Measures] at right)
• hide unnecessary columns (by right-clicking on them in the [Data] pane and selecting [Hide]):
Dates: keep only [Year], [Quarter], [Month], and [Date] columns (so hide all others)
Products: [Product Key]
Regions: [Region Key]
Sales: [Product Key], [Region Key], [Order Date]
Post-Modelling Activities - Measures:
• create a new measure in the [Key Measures] table for each entry in the DAX Measures text file
Post-Modelling Activities - Visualizations:
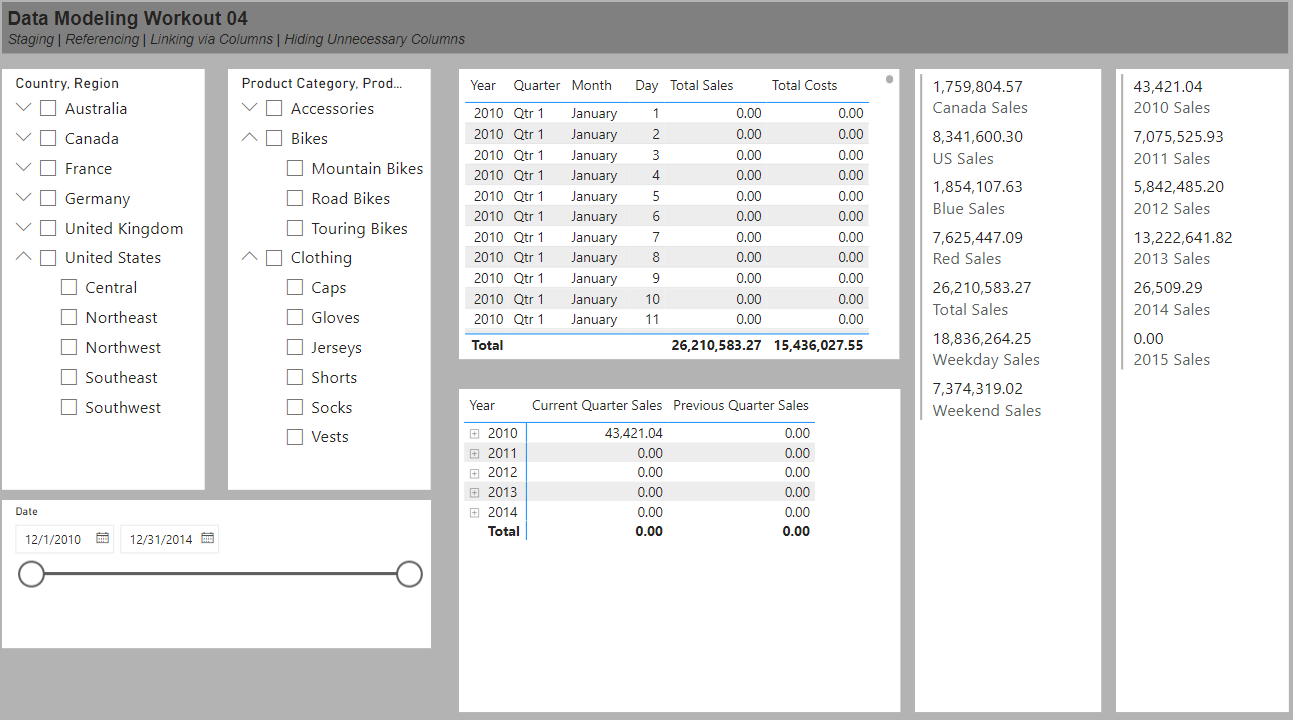
• create hierarchical slicer for Regions[Country] and Regions[Region]
• create hierarchical slicer for Products[Product Category] and Products[Product Subcategory]
• create slicer for Dates[Date]
• create a table for the Dates[Date] column and the [Total Sales] and [Total Costs] measures
• create a matrix with the Dates[Year] and Dates[Quarter] columns on rows and the [Current Quarter Sales] and [Previous Quarter Sales] measures on values
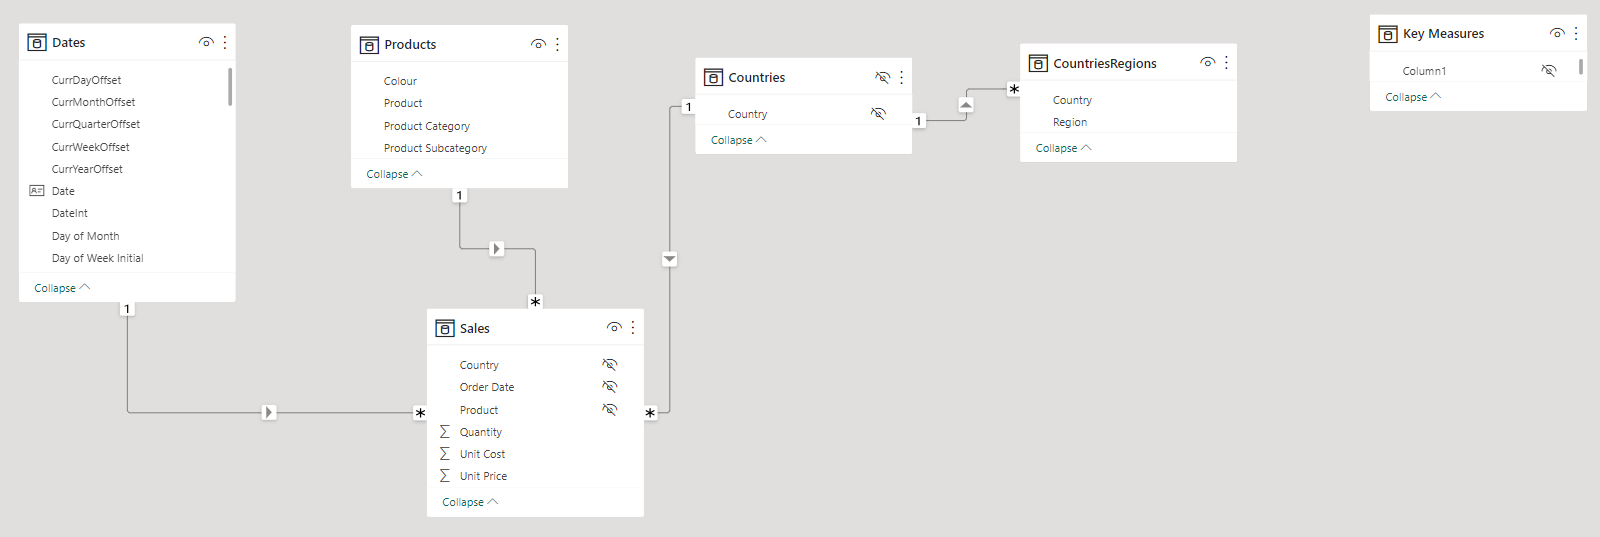
Hi everyone, quite late here, but I would appreciate if someone could help me understanding whether it would be wrong (possibly causing some problems down the line that I haven’t foresee, performance issues…) to follow this approach on the Star Schema, because it’s the first I came up with. I understand creating the numerical keys to replace the text on the Fact Sales data, but I’m not sure about using a Countries dimension table only for linking the Sales with Regions Table (to be honest, I first missed that the dataset has unique Region values).
Thank you so much for this amazing workout. Although I’m late in trying this workout, I was able to practice my learnings from previous workouts in this one.
These workouts are really helping in my day to day work and improving the dashboard modeling.
Also, I’ve a question : -
Que: I’ve started the practice of creating dimension table from the fact Table using referencing in my projects at daily work and its really helpful to create queries and calculations. I was curious to know if this practice of referencing is going to slow down the performance of my Data refresh or report, especially when the data size becomes huge and keeps on adding up.
And what should I do to improve the performance if its really slows down the process.
Would really appreciate if you could help with this.
Thank you for your kind words; @Brian and I are happy that you’re finding the workouts useful.
The asking of questions on solved threads is discouraged. To raise a new question/issue, please create a new thread and, if it is in reference to an existing solved thread, include a link to the solved thread.
@EnterpriseDNA, please break this question out into its’ own thread.
Nevertheless, in response, I’m not aware of referencing causing any sort of performance penalty. Any practice that reduces the “area” (rows x columns) of your fact tables should be a good thing and should improve performance. IMHO, the best test for performance-related investigations/analyses, though, is to try different approaches in your own specific environment, as data sources, network configuration, gateway settings, etc. have such a large impact on performance issues.
I couldn’t figure out how to start a new thread. Hence, mentioned my question in ongoing one. Will keep this in mind for future and also figure out how to start a new thread.
It is discouraged to add new issues to solved threads. Many forum members do not review solved threads, so your issue may be unseen. Rather, start a new thread with your issue and link to the solved thread to maximize the visibility.
@EnterpriseDNA, please split this thread into a separate thread, starting with yesterday’s post by @kenyatta67.
Regardless, for both of your questions, your [Dates] table was not marked as a date table; marking is essential for any time intelligence functions to work properly.