Hi everyone,
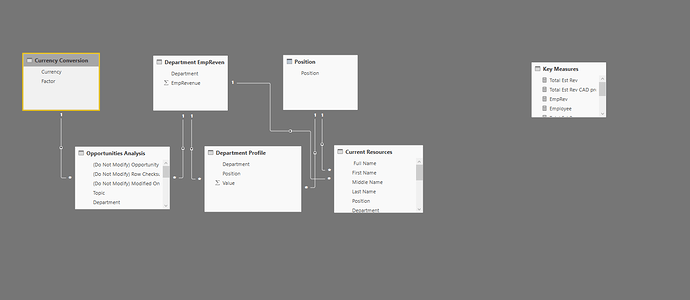
I am new to this forum and would appreciate your help, please ask me more questions if I miss any details. My goal is to summarize number of actual employees, projected employees and the delta by division and by position (finance, HR, developer,…),
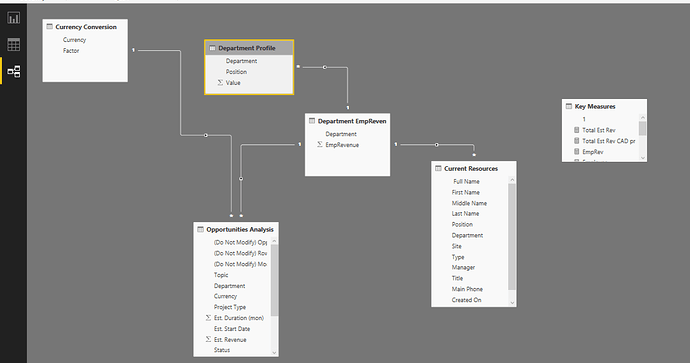
current resources table contains: division, position, employee name,……
opportunities analysis table contains: Division, start date of the projects, estimate revenue, probability, duration in month, project type,….
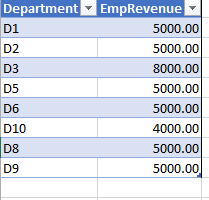
Department profile table : is a matrix with division in in rows and position in columns. The values are % position needed by division. We add to the table a column revenue. I was expecting to unpivot all except division and revenue column
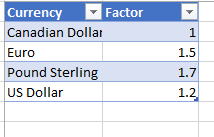
Currency table has currency and factor
data model.docx (119.6 KB)
- Please can you help how to organize the data model. Below what I try.
- This second question is this how to organize the data model, I would like to develop it in another to separate question, since I believe it’s about dax formula using lookupvalue,….the goal is to forecast the expected employees by division for the next six month based on the selected value…
My formula:
= DIVIDE(SUMX('Opportunities Analysis','Opportunities Analysis'[Est. Revenue]*'Opportunities Analysis'[Probability]*RELATED('Currency Conversion'[Factor]))/100,SUMX('Department Profile','Department Profile'[EmpRevenue]),0)
To the formula above in need to add value from the department profile table
And
Add the condition below
AND(
      ([@Department]="Air"),
      (YEAR(NOW())-YEAR([Est. Start Date]))*12+MONTH(NOW())+n-MONTH([Est. Start Date]) < [Est. Duration (mon)],
      (YEAR(NOW())-YEAR([Est. Start Date]))*12+MONTH(NOW())+n-MONTH([Est. Start Date]) >=0 )
n : n=0 four 1st month,n=1 for second month,……