Scenario:
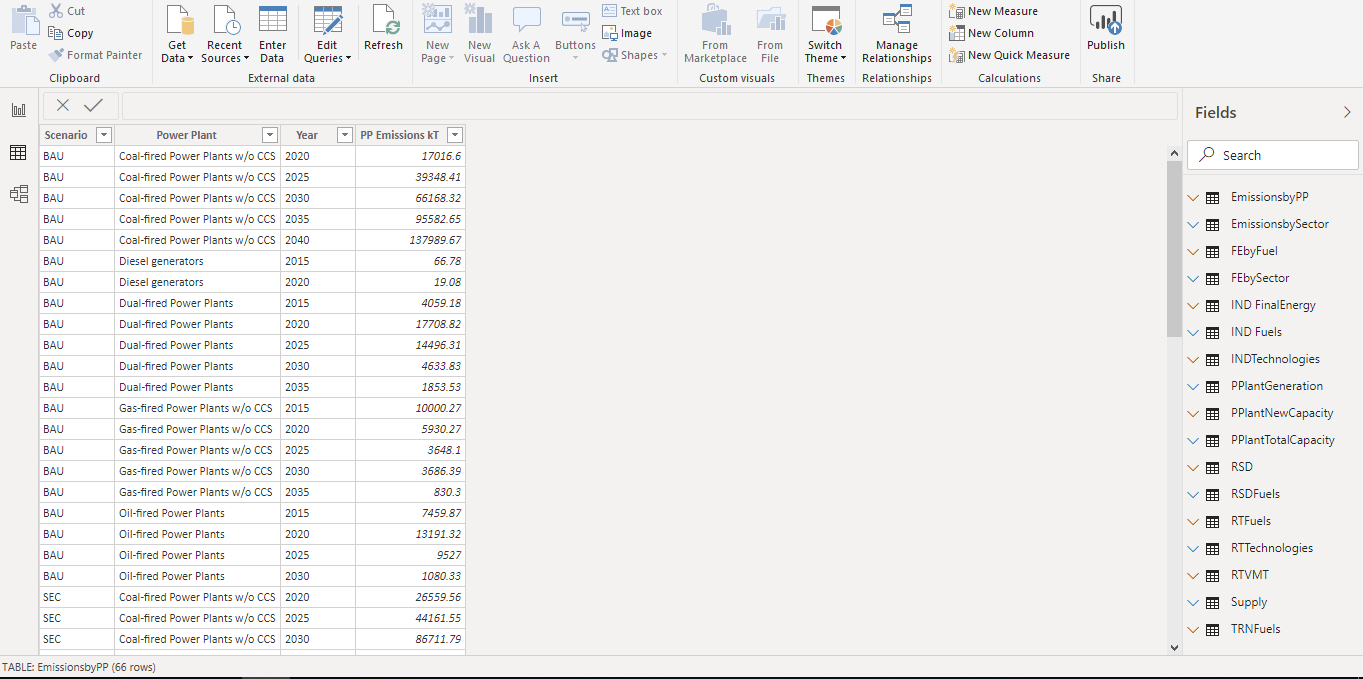
I am trying to convert intense tabular data into Power BI report. For this purpose, I prepared many tables of similar nature but having unique data values. Each table has 4 columns.
1- Scenario
2- Year
3- Process or Process Set or Commodity or Commodity Set
4- Values (Energy Use or Energy Supplied or CO2 emissions or Capacity GW)
Problem:
At present, I have imported all the tables separately and made visuals for each table without any integration among themselves. For instance, I am not able to construct the appropriate data model and each table lies on an island.
I want to prepare the data model having dimension tables and fact table. Because of mismatched data in two columns, I am not able to append the table.
Requirement:
What’s the appropriate way to model this type of sector so that, I could be able to slice and dice data comprehensively. How can I develop the functional keys to join these tables?
While this uses a different data scenario it has been created in a way that you could replicate all of these best practices across any data that you have.
Literally every best practice I have around how to think about your data model and how to implement a quality data model is covered in this detailed course.
This is where I direct all members to focus the efforts if they need to look at modelling of varying types of data.
One of the first key things you need to think about is what is a lookup table and what is a fact table. Currently it does not seem that you have this classified in your model or in your mind even.
Highly recommend, when you can, to go through this course. Of course if you still need assistance after that you always have the support forum available.
I would first separate your information in Fact Data (normally has many date transactions) and Dimension Data (normally static describing fields). Once you have done this you can then start to work out how to build the model and create the relevant relationships required.
Its a little bit complicated to start building models without doing the theory. Its well worth the effort though or you can engage a power bi consultant to assist ! Reach out if you want direct consulting help with this.
Thanks Sam. It’s my first month to Power BI. I thoroughly took the above mentioned course.
The confusion lies between the different numeric values (MTOE, GW, kT, Million Vehicle Kilometer mvkm. of last column present in each table. Due to these values I felt difficulty to append these tables at each other. Sometimes, I thought to create at least four fact tables and join them against the dimensions available for each table. however, a small clue to manage this data will work.
I can develop the each of dimension such as Process, Commodity, Process Sets/Commodity Sets, Time Slices, Attribute, Scenario etc. But thinking, to develop one fact table appending data by bulk import of files from Folder, is not being developing.
Well currently I can see you have one set of facts called PP Emissions Kt facts which have different dimensions like by PP or by Sector, by fuel etc. I can see its referring to a year only. You would also need to check if you facts are all at same granularity. ie all based on years or months or dates.
Its hard to make a solid recommendation without diving in a bit more to your scenario as its more of a consulting question you are asking on what way should you proceed.
I would start off with one set off facts and build the required dimensions and go from there.
Before you do anything go through Sam’s data modelling videos and that should set you on the right path! Good Luck!
A suggestion for merging all tables together. If the data type of that 4th column (Values in your OP) is the same (such as a decimal), then all you need is a 5th column for each table which specifies a category for what the Value column represents. For example, using acronyms: EU, ES, CO2E, CGW.
Add that 5th column to each of the tables as a hard-coded value since every row in each table has the same category. Then append all tables together and each row will have a category which identifies what kind of value is represented by the 4th column. You can then calculate measures for specific categories using filter statements.
If the data types of the Values columns differ, such as one table is text and another is numeric, then you have to stick with separate fact tables, although they could still make use of shared dimensions such as Power Plant or Year (Dates table).
Note that a whole number in one table and a decimal number in another are still effectively the same data type. You use the numeric data type with the greatest precision in the final table and then format as needed.
You can certainly have multiple fact tables if it makes sense. If the data in your fact tables is quite different and it’s basically covering a totally different aspect of information then having seperate tables is fine.
If the data is similar though and logically they could go together then I would attempt to consolidate.
Just also think that anything you need to count up, sum or average …basically do any calculation on, you want to be doing that from a fact table.
Your lookup tables should mostly be filters for calculations you do in your fact tables. This is not always 100% true but almost I find.
Well. Will there be any conflict if we have four fact tables and join them with the same dimension Tables?
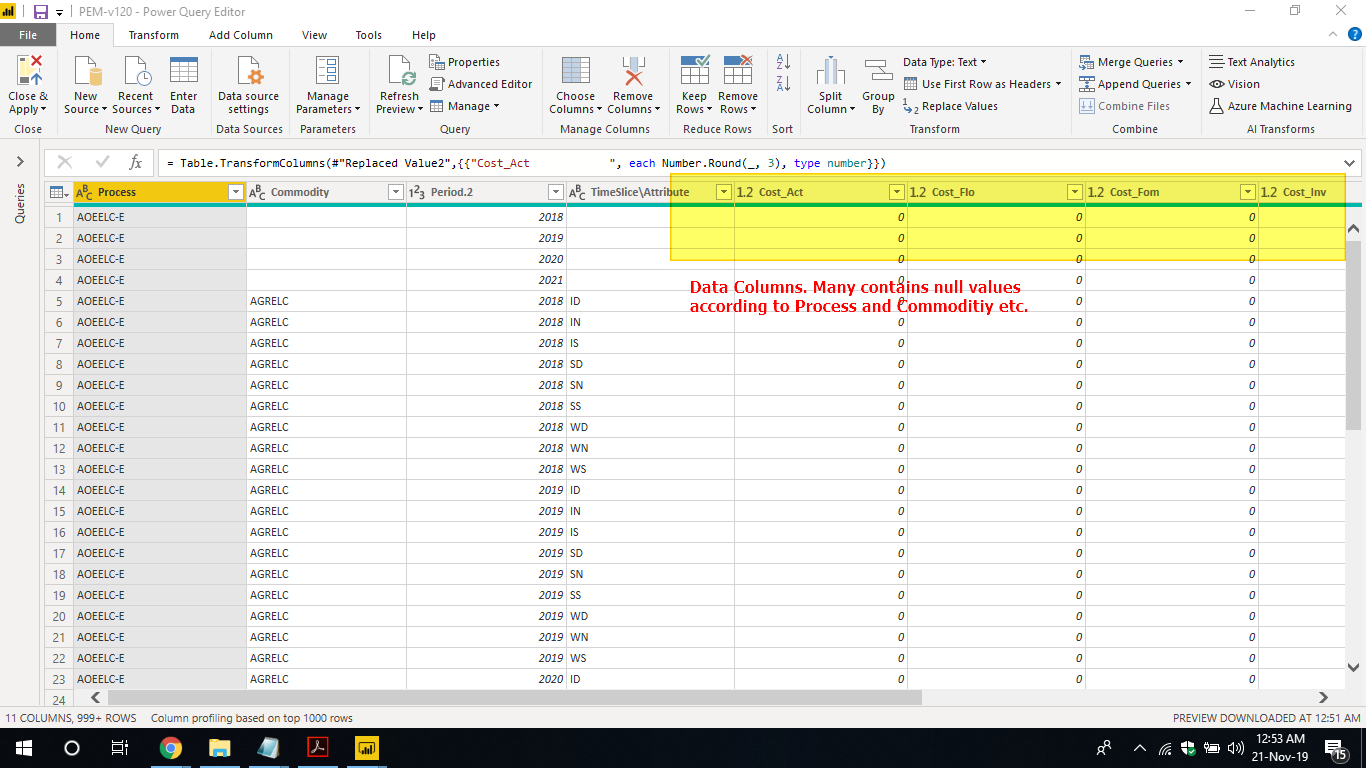
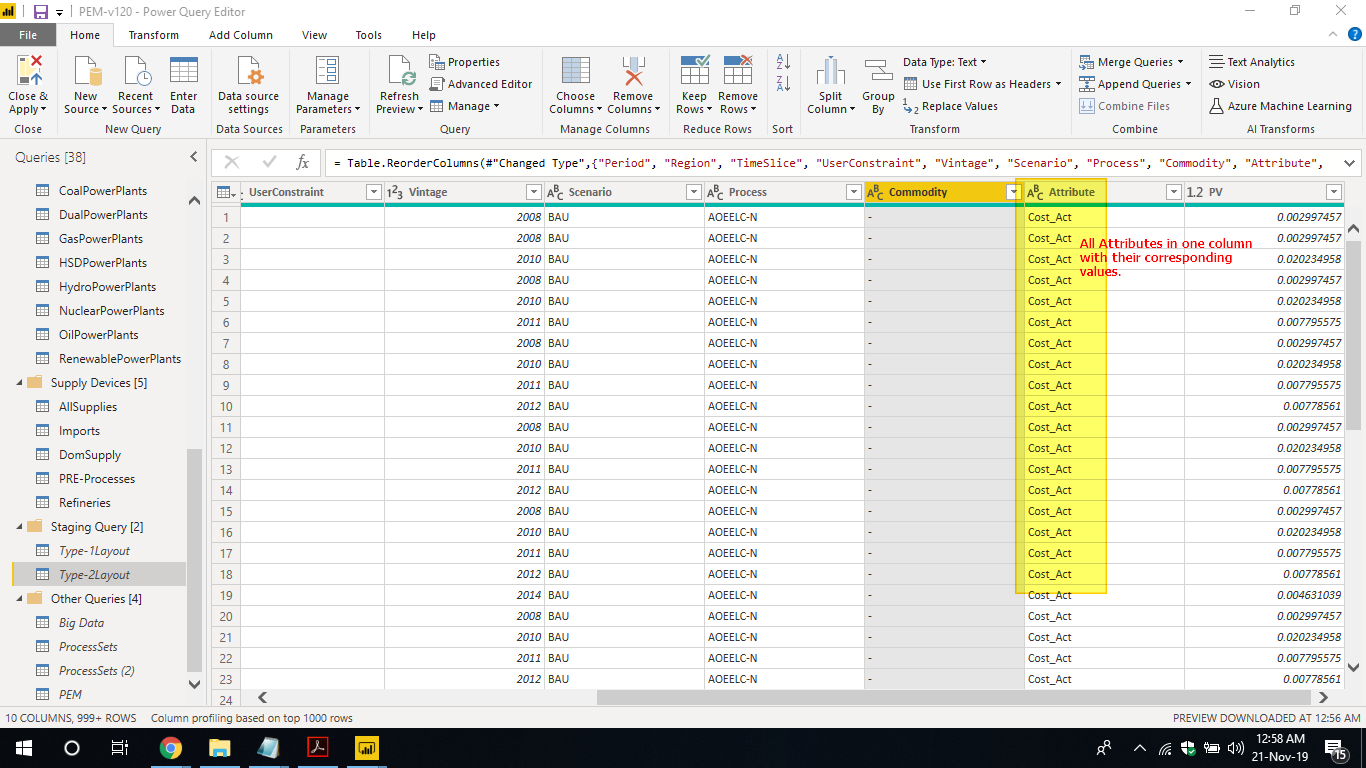
I have made two layouts of single Fact Table.
1- Preferred Layout: I put the attributes in each separate column. Unfortunately, I am still not able to directly aggregate the columns as different corresponding technologies and commodities have to be filtered.
2- Type-2 Layout: I am seriously thinking about this as Fact Table. All attributes are in same column and will be filtered through DAX or using visual filters.
3- Third option may be the totally separation of GW, GWh, kT, mvkm etc. It needs extensive work in Power Query and developing four different Fact Tables.
I’ve previously done some significant report building for an energy client and can totally understand how your model can become complex because these did become so as well.
If you have a common dimension table or lookup the table that works across different tables that’s exactly what you want. That’s the most efficient way to model data in Power BI so that you don’t have any duplication of information where there doesn’t need to be.
You ultimately want your look up tables to be common attributes or dimensions across many fact tables. In the energy market common ones would be nodes, dates, locations, customer
The Type-2 layout you mentioned is exactly what I was getting at in my previous reply. When you calculate measures for the various values (GW, GWh, kT, mvkm etc), you can filter on that column.