This problem is not the traditional dynamic slicer (calculating totals for either revenue, costs or profit). I would like to create a dynamic slicer which allows me to explore a lookup table of customer. I hope I can abstract my specific problem into a generic problem that helps explain the challenge:
I have a customer table (lookup), sales transactions by date and product (fact)
Meeting categories: I have a customer meetings by type, linked to customer lookup table
Product Categories 1: I have a products table listing product categories, and this table is linked to the products in the sales table
Product Categories 2: I have a second product category table listing products and categories, also linked to sales table
“Slicer 1” lets you choose how you will be filtering customers, and summarizing sales by choosing from “by meeting category”, “by product category 1” or “by product category 2”
“Slicer 2” Dynamically changes the list of multiple selectable items based on slicer 1
I figured out the slicers as follows:
A “hanging” table with a row for each value in the 3 filter categories and an extra column called “type” which can be a 1,2 or 3. Example:
This way the first slicer chooses one of 3 values from a custom table and the second slicer filters the union table looking for a particular type.
This is as far as I advanced. Clearly it wont work because you can not create relationships between the type 1 records and the customer meetings table.
I hope my description is clear and you can think of a creative approach?
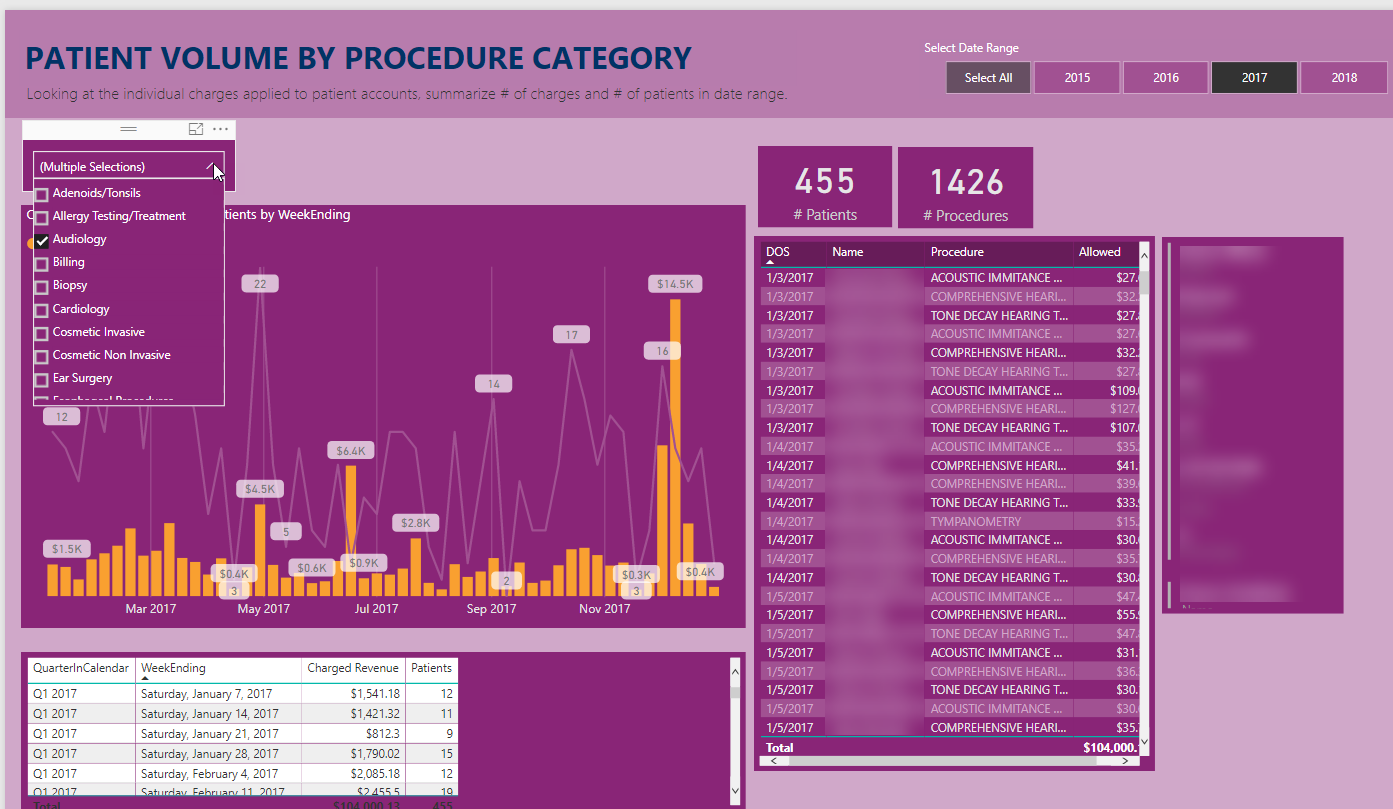
Here is an example of a page in the report which displays information from one of the 3 dimensions I mentioned. Because I was trying to remain at a higher level of description - my example above is not exactly my use case, as you can see.
(Ps - the table at the bottom left is a copy of the graphic above - so you can see the numbers being pulled out)
The purpose of this report is to generate the list of patients who underwent a procedure by slicing in 3 ways. I am trying to fix the Dr.'s office mess in data consistency but until then they have lots of patient data in 3 different ways I would prefer to offer in a single slicer:
So - if you are seeking patients who had a certain procedure you can slice it these 3 ways:
By the category of the appointment, they were scheduled for. Appointments (encounters) relate to charges, where the revenue is recorded. Aggregation is at the patient record level. Call this “Appointment type category” (Type 1)
By the built-in category of the procedure performed. Here the aggregation is directly from the charges table - aggregation of individual line items (“sales”) and their built in classification. Call this “AMD charge code category” (Type 2)
The practice does not find the built in classifications are working so came up with their own lookup of charge code to category. Call this “[practice] categorization” (Type 3)
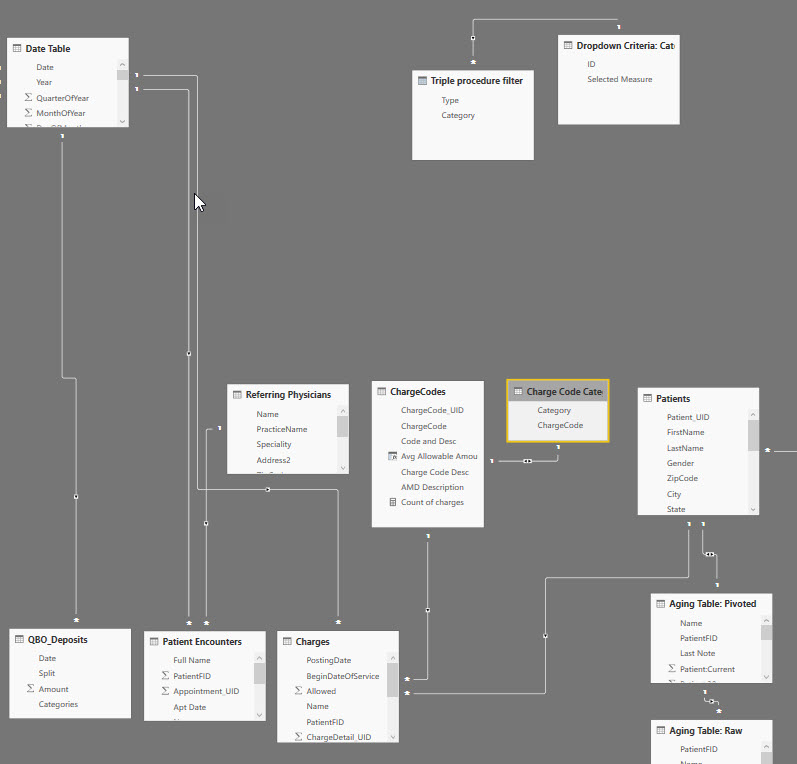
So since the lookup is from 3 tables, I merged the categories to a single table:
Clearly I am missing a third (or more) field to link back to the lookup tables but here is the conundrum:
If the user chooses Type 1 - I need to link to filter related charges for encounters tagged as having a certain appointment type matching selected appointment type from the drop down
If the user chooses Type 2 - I need to filter related charges where the charge code has a category matching the selected category from the dropdown
If the user chooses Type 3 - I need to filted related charges where the charge code maps to a new charge code category matching the selected category from the drop down.
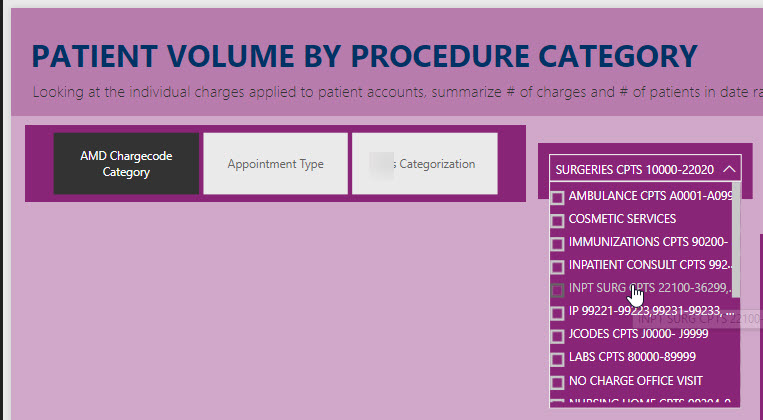
Here is a screen shot of the cascading dropdown working, but of couse the summarization is not working because I can’t figure out the data model or how to get the related records to work:
(PS: I don’t know if there has been a messup in the May edition of PBI desktop but it seems to lose my beautifully arranged layers quite often - so I find my self rearranging the tables multiple times).
On the top-right are the drop-down set of tables:
The “Dropdown Criteria” is a fixed table with 3 rows and corresponding ID
The second table (“Triple Procedure Filter”) is the result of the UNION query up above
It’s truly quite difficult to understand everything here but I am trying. It’s just the unfamiliarity to all the data.
It seems this table you have create is a lookup table, but I want to make sure are they all related?
Because it seems you are consolidated them but then asking for the to filter different things again and maybe they are better are separate tables?
If you want to filter a slicer, you really need to have that dimension in the same table, so that it will happen naturally if you select something in the slicer. I would really aim for this.
Can you work in some calculated column logic to be able to achieve it this way?