A few questions about data sources for a data model and a few questions regarding modeling.
I have twelve years of historical data in CSV files. In total it’s 3.5 million rows but it is only five fields in width. Is it better to write twelve queries for importation and append all the data into one new Append Query, or Append then export it out as a single CSV file with DAX Studio, and then reimport it for a one source file solution? Any likely performance difference?
Is there a way to dynamically load partitioned data based on what a visual needs for a particular time period? For example, I need the earliest six years of data for only three out of the twenty-four desired reports – but those three are important.
Once those records are imported, I have a few conceptual challenges for modeling. I’m trying to get an idea of the best approach.
Our fact table will be straightforward. The five fields are as follows:
LocationID (Doesn’t change but multiple locations per CustomerID)
CustomerID (Changes relative to LocationID over time. No multiple Customers per LocationID)
Customer Class (May change but rare)
Date (transactional)
Amount (transactional)
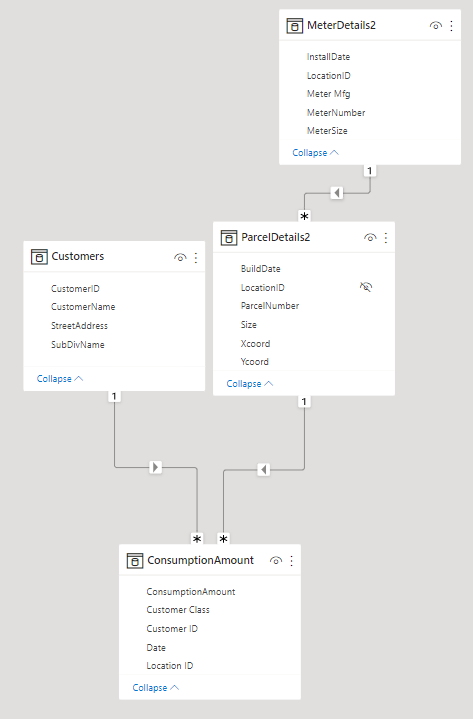
The dimension tables are different. Besides incorporating the Extended Date Table (thank you very much EDNA!) there are Customer, Meter, and Parcel data tables. Again, new customers can occupy the Locations. But also, Meters can change per location when they fail and get replaced. Their serial numbers are all unique but they are not permanent.
Is the best approach, maybe the only viable approach, the creation of a unique record ID when creating the dimension tables? Is it even feasible to do the required merge with a 3.5 million row fact table?
I’m uploading a sample model but it’s wrong. The Location ID can not be used as a unique identifier in the Meter table because a location can have multiple meters.
@RandyS
With regards to your CSV files, it depends.
3.5m rows is not huge, and if they are all the same structure, and you are just appending them together, I would probably just do a file combine by getting data from folder.
For the three that are special, it might be worth importing these as a separate combine, so you can filter them for the last 6 years.
I’d really need to see what the raw data looks like to give you a more precise answer.
WRT the modelling.
You are on the right track. I like that you have implemented the Collie method for layout (assuming this was intentional). It really helps clarify how the filters are propagated through your model.
Generally speaking, when designing the model, start with your transactions. Look for repeating, descriptive data. These are the details that belong in the dimension tables.
I usually ask the questions Who, What, Where and When.
Following this approach, you won’t end up with location information in two different tables, unless of course you are building a Snowflake schema, where Meters 1–>* Locations 1–>* Consumption.
Thank you, Jason. One other challenge I see is tracking changing Customer data over time.
Each time a new Customer takes over a Location, I’m going to lose the previous Customer connection to that Location because the monthly activity Customer file will only contain the latest CustomerIDs. Once a customer stops service, their CustomerID is removed from the customer file we receive each month.
Therefore, a report based on Customers will only report the history for the current CustomerID, not all of the consumption for Locations associated with earlier CustomerIDs. Make sense? What’s the best way to handle this? Thanks.
Hi Randy,
Yes. This is a common problem.
Power BI is excellent at reporting the current state of affairs, but unless you capture historical snapshots, you can’t look at how things have changed over time.
Generally speaking, my approach to managing this is to create regular snapshots of the data. Depending on how quickly things change this could be monthly or just annually, but basically I download an extract of all of the raw data I use in the pbix and save it. Typically as an Excel file.
Then I build logic into the data acquisition to consolidate all of the historical data along with the current data, and flag them with an appropriate index on the way in.
The reason I save the raw data (pre-transformation) is then if my transformation needs change, I know the Historical data will be transformed the same way as the current data.
With your Customers example, taking this approach means even if customers drop off the current data, they will appear in your historical data, and thus can still be integrated into an appropriate dimension table.