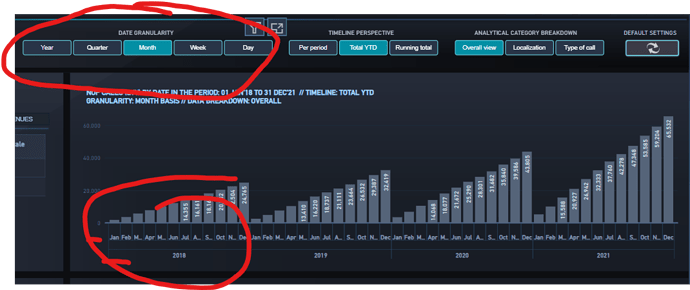
Hi everyone, how can achieve this slicer and have this visual? I believe it is not the default column chart or am I missing something here? Thanks in advance ![]()
For the Data Granularity Slicer:
Read through for the solution presented using SWITCH and SELECTEDVALUE:
You can also use a Custom Visual for this purpose:
For the two X-Axis Column Chart Visual:
Follow the below article.
https://www.pluralsight.com/guides/implementing-hierarchical-axis-and-concatenation-in-power-bi
2 Likes
