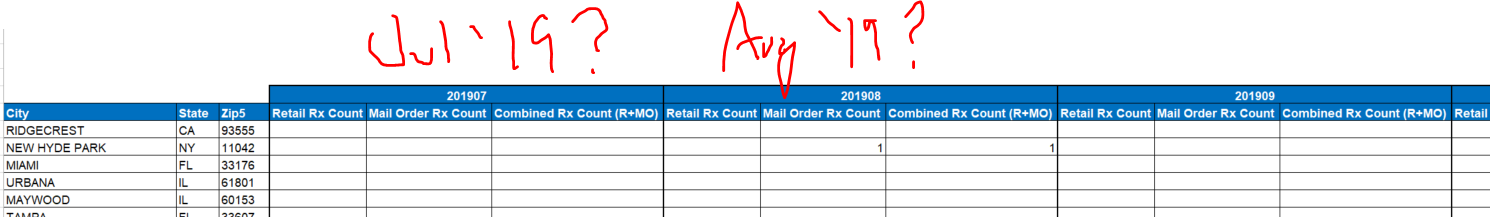
I just got an Excel file that I’m supposed to analyze in Power BI, but I’m not sure how to make the data usable. See screenshot below. How do I get separate line items for each field for each month? And in reality, I think I just need the first two for each month as the third is a sum of the first two.
In addition to @Heather suggestion you can also check out this article, it’s pretty well documented.
For future searches I’ll add some key words: turn your table into a proper tabular format, nested table headers, multi line table headers, unpivot, pivot.