Data Challenge: Discovering Shopper Segments: An E-Commerce Dive
Duration: 2 hours
Difficulty: Intermediate
Intro:
E-commerce is booming, and knowing how customers shop is key. This dataset gives you a look at how customers interact with different brands. Dive in and see if you can spot trends or unique insights.
Explore the Data: Take a first look at the dataset. Which brands are there? What info is available about the customers?
Think of a Theme or Question: Here are some ideas to start with:
Do men and women prefer different brands?
Which brands are most popular?
Can you group customers by how they shop?
Do some customers buy more than others?Or, explore any other question that catches your eye.
Analyze and Draw: Once you’ve picked a focus, start your analysis. Use charts to help show what you find.
Share Your Findings: What did you learn? Can you guess why some patterns might be happening?
Recommendations:
It’s okay to focus deeply on one idea.
You have 2 hours, so plan out how you’ll use that time. Spend some time looking, some time analyzing, and some time wrapping up.
Use any tool you like. The main goal is to learn something new from the data.
Deliverables:
A short report or slides about what you discovered.
Visualizations that support your insights.
A simple summary of your main takeaways.
Submission Due Date: October 27, 2023
How to submit:
Take an image of your report and post in this Forum thread
Include a live link to your report
Provide context and a brief explanation
We also encourage you to share your experience of participating in the challenge by sharing it on social media and tagging Enterprise DNA. Share an image of your report and do a brief description of how you approached the project.
Any answer for what does Orders Column mean?
This challenge submission due date was last month, and I cannot see hardly any discussion or submission, does it mean that no one is interested?
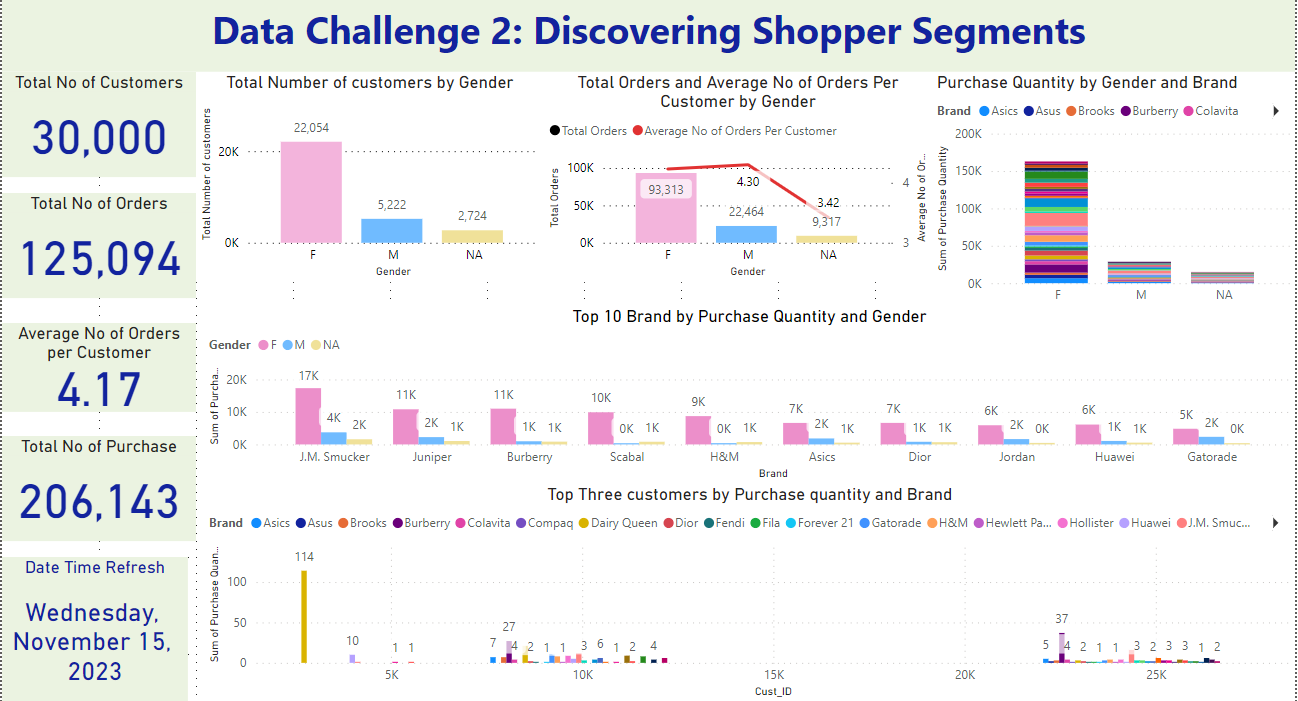
The data analysis shows that there are a total of 30,000 customers of which 22,054 are Female, 5,222 are Male and 2,724 gender is not available. There are a total of 125,094 orders and the average number of orders per customer is 4.17. There is not much difference in the average no of order between male and female. There are a total of 206,143 purchases and women prefer different kind of brands than men.
J.M Smucker is the most popular brand by both men and women. Juniper is the second most popular brand by women and third most popular brand by men. Gatorade is the tenth most popular brand by female while it is the second most popular brand by men.
Most of the customers purchase items within the range of 1-27 items, The top three customers data shows that Customer ID 9912 purchased a total of 160 different brands including 27 Burberry. Customer 4130 purchase 114 dairy queen brand alone out of total 125 purchases. Moreover Customer 24366 purchase a total of 37 Burberry purchase out of 64 purchases.
The data analysis unveiled distinct patterns, including gender-driven brand preferences, widespread popularity of J.M. Smucker among both male and female customers, a notable gender-based discrepancy in Gatorade’s popularity, and instances where certain customers exhibit an exclusive focus on a specific brand.
Without data dictionary and further clarification (on @Remi10 questions) - we can only make assumptions.
Here are mines:
Orders are number of orders
In other columns are quantity of products that finished in the basket (some were bought, some no - we can see in number of orders)
Before further analysis - I made:
Brand Grouping
Divide Customers with Orders (75.7%) and without Orders (order = 0 )
Divide Customers by Female and Male (only customer segmentation available in this dataset) and calculate F/M Ratio
Please note that in this dataset there were no date data available (so we could not make any trends and time intelligence comparison). Also there is no sales amount figures. So this is a analysis based on available data:
Customers with more then 5 Orders (5+): 11,164 (37.2%)
Most Sold Brand Type :
Foods and Beverages
Customers with Order : 16,785 (73.9% total)
Quantity sold: 51,707 (32.1%)
F/M ratio (in customers with Orders): 4.35
F/M Qty ratio (in Qty sold): 4.59
Most Sold Brand - Ordered by Qty sold:
J.M.Smucker - top Brand both for Females and Males
Juniper - third brand both for Females and Males (but overall second)
Burberry - 2. for Female Qty (4. for Female Customer number) and 12. for Males (both Quanty and # M (ale Customer number)
etc. (details are available in table)
Gender-based Sales Analysis:
Female Sales:
Total Female customers (with Order): 16,962 (74.7% of total)
Total Female Sales Quantity: 128,351 (79.8% of total)
Male Sales:
Total Female customers (with Order): 4,016 (17.7% of total)
Total Female Sales Quantity: 22,532 (14 % of total)
Others (N/A Gender)
N/A Customers (with Order): 1,724 (7.6% of total)
N/A Sales Quantity: 10,028 (6.2 % of total)
Female-to-Male (F/M) Ratio Analysis:
F/M Ratio (Customers with Order): 4.22
F/M Ratio (Quantity Sold): 5.70
highest F/M Brand Type (Customers with Order, Qty Sold) : Clothing
lowest F/M Brand Type (Customers with Order, Qty Sold) : Sportswear
Your dashboard is so nice. I am able to do all required measures as yours, however I was not able to figure out how the insights in the report are created especially the graphs. Could you please share the file.it really helps.
Thanks
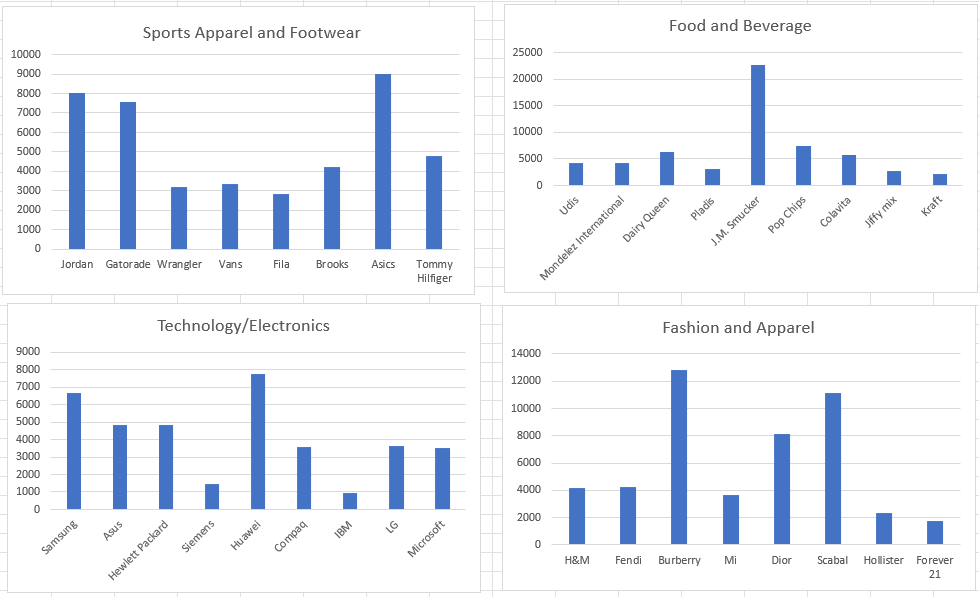
Sports apparel and footwear: This industry shows the most significant growth, with the number of buyers increasing from around 1,000 to 9,000. This could be due to a number of factors, such as the increasing popularity of athleisure wear, the growing interest in fitness and wellness, or the endorsement of popular athletes.
Technology/Electronics: This industry also shows steady growth, with the number of buyers increasing from around 2,000 to 8,000. This could be due to the increasing demand for new gadgets and devices, or the growing popularity of online shopping.
Food and Beverage: This industry shows the least growth, with the number of buyers increasing from around 5,000 to 7,000. This could be due to a number of factors, such as the increasing popularity of healthy eating, or the growing competition from online food delivery services.
Brands: Within the sports apparel and footwear industry, Jordan, Gatorade, Wrangler, Vans, Fila, Brooks, Asics, and Tommy Hilfiger are the most popular brands.
Brands: Within the technology/electronics industry, Samsung, Asus, Hewlett Packard, Siemens, Udis, Huawei, Mondelez International, Compaq, Dairy Queen, IBM, Pladis, J.M. Smucker, Microsoft, and Pop Chips are the most popular brands.
Brands: Within the food and beverage industry, H&M, Fendi, Burberry, Miu Miu, Dior, Scabal, Hollister, and Forever 21 are the most popular brands.
Hello Everyone,
Please find the attached report on E-Commerce Dive.
It has different data classified according to the gender.
The data shows that there are a total of 30,000 customers from which 22,054 are Female, 5,222 are Male and 2,724 gender is NA.
There are a total of 125,094 orders and the average number of orders per customer is 4.17.
It displays the total brands used by both male and female.
Review the data for thorough data .
Thank you!! Screenshot 2024-08-20 200945.pdf (53.0 KB)