Data Challenge 1: The Pursuit of Happiness: A Decade’s Exploration

Data Challenge 1: The Pursuit of Happiness: A Decade’s Exploration

Duration: 2 hours

Difficulty: Intermediate

Start Date: September 6, 2023

Intro:

The World Happiness Report is a landmark survey that ranks global countries by how their citizens perceive their lives. The datasets provided encompass a decade of data, revealing patterns, trends, and perhaps some unexpected findings. In this challenge, participants are encouraged to dive deep, explore, and come up with unique insights and visualizations.

Download your datasets here
World Happiness Report.zip (100.0 KB)

The Brief

Steps:

1. Explore the Data: Familiarize yourself with the datasets to understand the metrics available and the countries covered.

2. Identify a Theme or Question: While the datasets revolve around happiness, there are multiple facets to explore:

  • How does economic prosperity relate to happiness?
  • Are there countries where happiness declined despite economic growth?
  • How do perceptions of corruption influence happiness scores?
  • Are there any outlier countries that defy global trends?
  • … or any other question that sparks your curiosity.

3. Analyze and Visualize: Once you’ve identified your theme or question, start your analysis. Use visualizations to highlight patterns, trends, and insights.

4. Narrative and Insights: Beyond the numbers, what story does your analysis tell? Can you hypothesize reasons behind the patterns you observe?

Recommendations:

  • While the challenge is open-ended, aim for depth rather than breadth. It’s better to have a well-analyzed theme than multiple surface-level observations.

  • Given the 2-hour limit, manage your time wisely. Allot specific chunks of time for exploration, analysis, visualization, and summarizing.

  • Feel free to use any tool or platform you’re comfortable with. The goal is to derive insights, not mastery of a specific tool.

Deliverables:

A brief report or presentation showcasing your findings.

Visualizations that complement your insights.

A concise narrative that connects your observations, providing context and possible explanations.

Submission Due Date: September 24, 2023

How to submit:

  1. Take an image of your report and post in this Forum thread

  2. Include a live link to your report

  3. Provide context and a brief explanation

We also encourage you to share your experience of participating in the challenge by sharing it on social media and tagging Enterprise DNA. Share an image of your report and do a brief description of how you approached the project.

All the best,
Enterprise DNA Team
1 Like

Ok,

Was a great session during my live recording.

Remember you can post any insights within here, and use any tools going forward.

I think sticking to max 2 hours is a good idea as well.

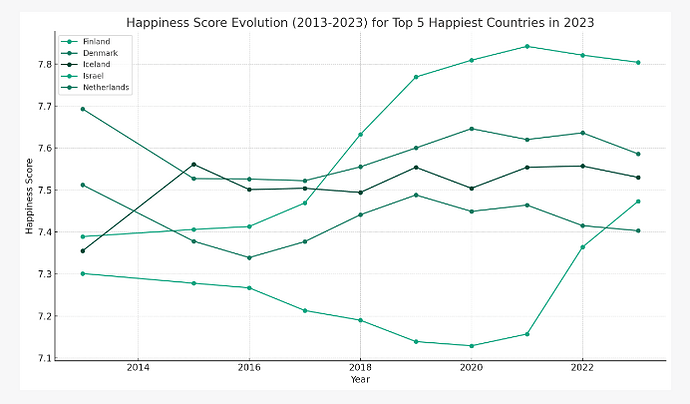
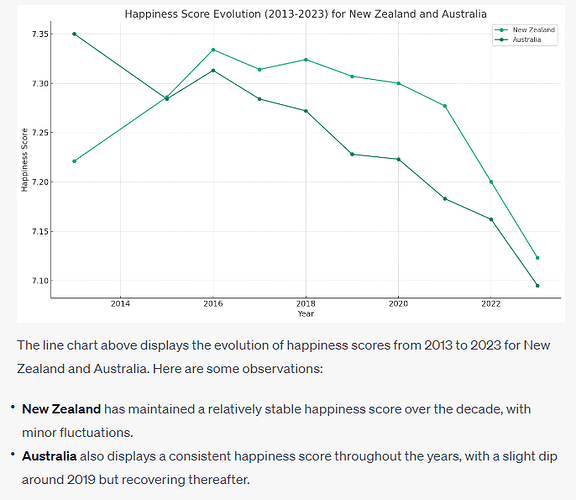
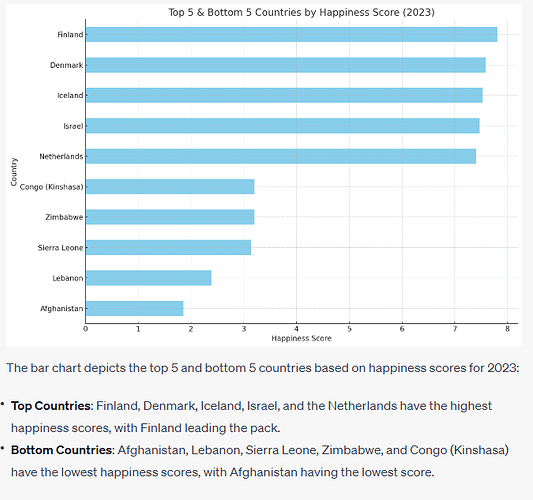
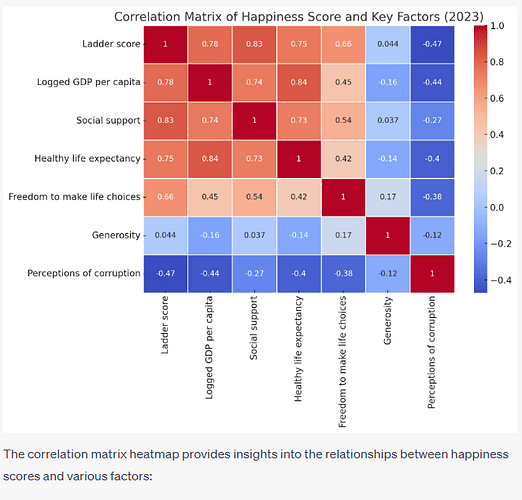
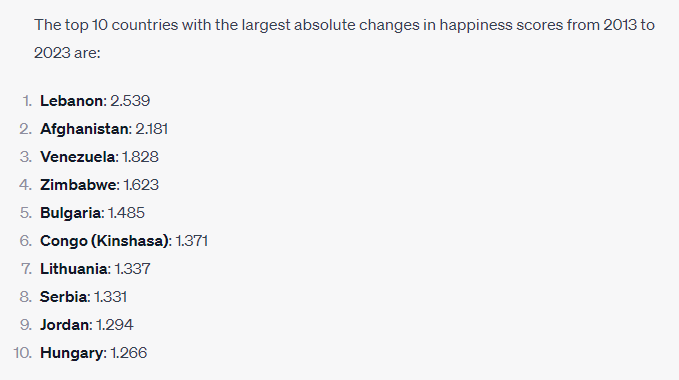
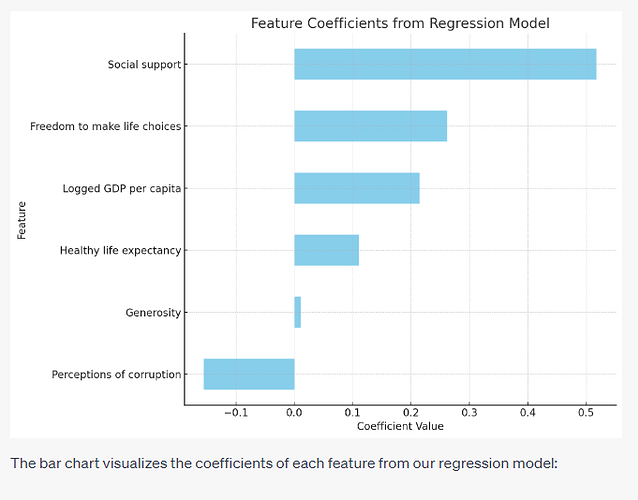
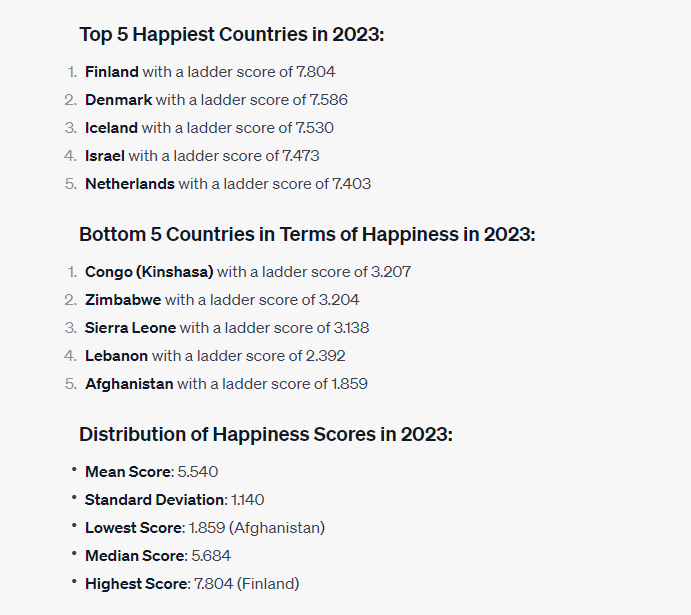
What happening during the live stream was that I stuck just to ‘advanced data analysis’ in ChatGPT. Provided me all the analysis I could need to work through the data.

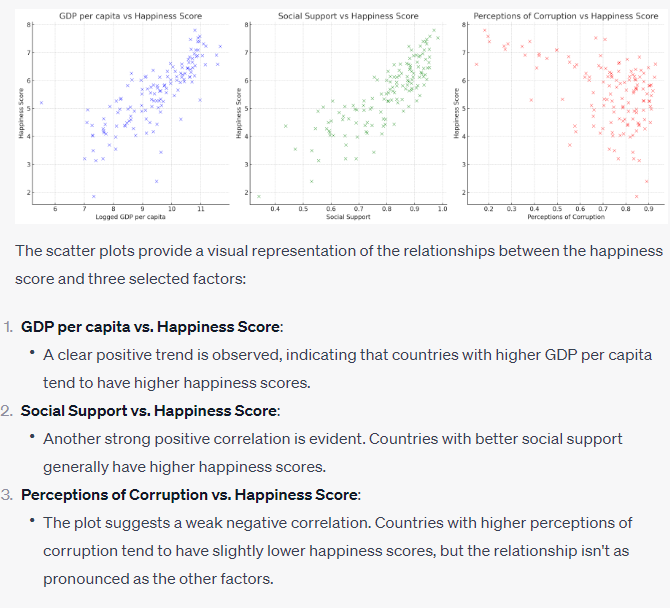
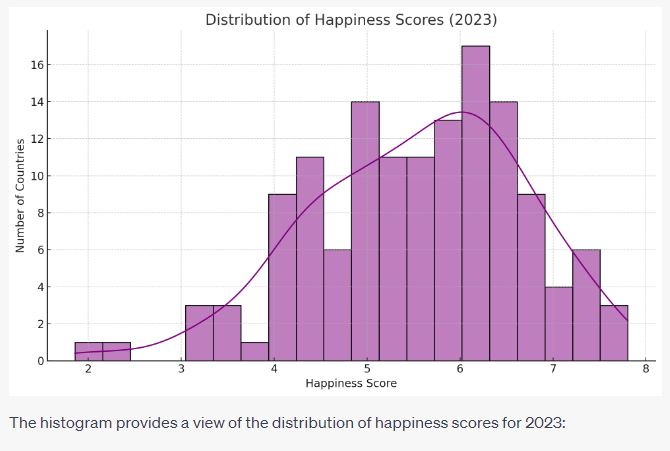
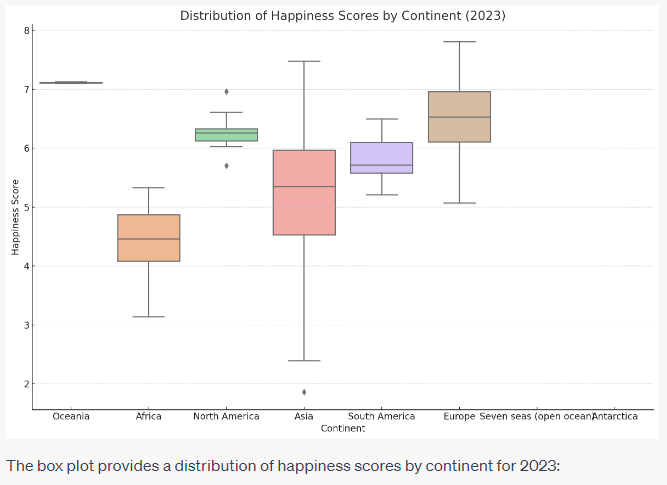
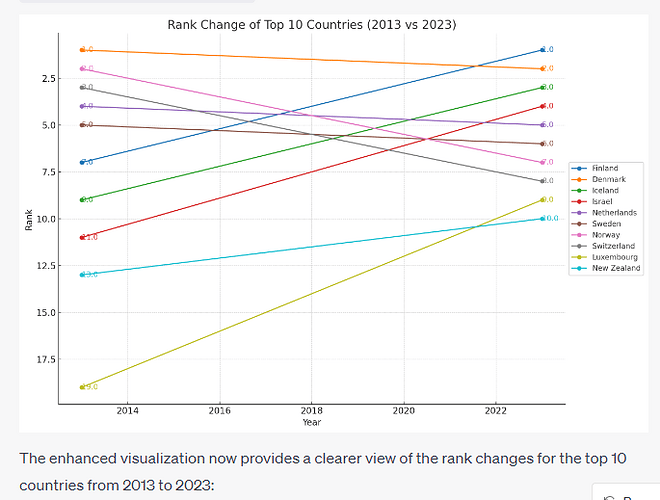
Here’s some of the interesting insights

The speed in which it created these insights was quite amazing.

image

image

image

There’s more, but I’ll stop there.

If you want to review the entire thread. Check this out below

https://chat.openai.com/share/d90a078d-242b-4fa9-b94c-a73cedc46887

Fascinating times we are in within the data space!

I’m blown away by how effective this is.

I’m challenging you all to get involved. Find insights any way you like and share them here.

Hi @SamMcKay ,

I need help.

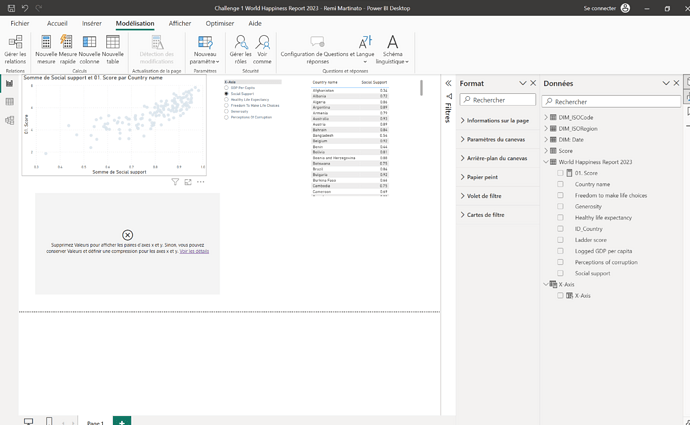
I would like to create a scatter plot with the score on the Y-axis and other indicators (Generosity, etc.) on the X-axis, but I’m getting an error message.

Could you help me?

Thank you.


Challenge 1 World Happiness Report 2023 - Remi Martinato.pbix (485.6 KB)

Hi @Remi10 ,
check what you put in Values field of your scatter plot -it seems to cause the problem

Keep up good work.

Best regards

2 Likes

Hi all,

After recently finished Machine Learning models in PowerBI (many thanks again to Gaelim Holland for preparing this):

I was trying to find sample dataset that I could use to explore this further - and here it is.

For exploring this I used PowerBI and Python.

Since there are so many countries - I decided to connect Countries to Continents (several external Web source + additional minor adoption)

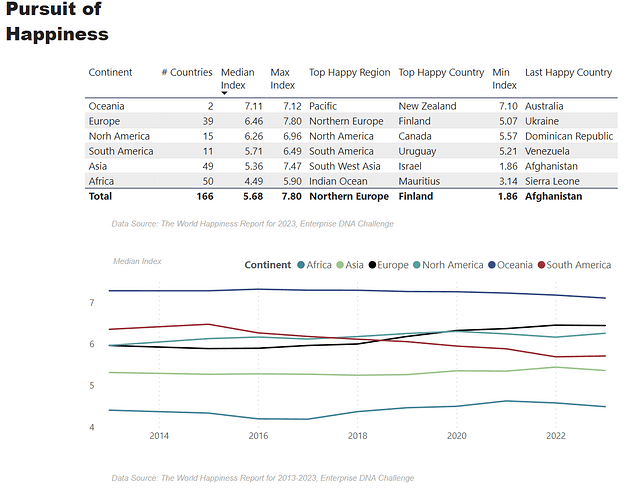
Based on the World Happiness Report follow are the findings by Continents :

Pursuit of Happiness:

  • highest in Oceania (median 7.11) and Lowest in Africa (median 4.49)

  • highest in Finland (median 7.80) and the lowest in Afghanistan (median 1.86)

  • in the table is overview per Continent - where you can find the lowest and highest median index

  • changed over time - especially for South America and Europe

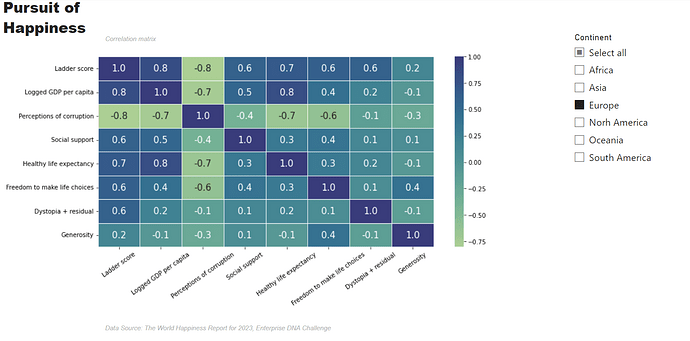
Additional Correlation Matrix was made with Python visuals (Seaborn heatmap) & PBI Slicers :

Since in Seaborn heatmap I used crest color palette, I adapted colors on other pages.

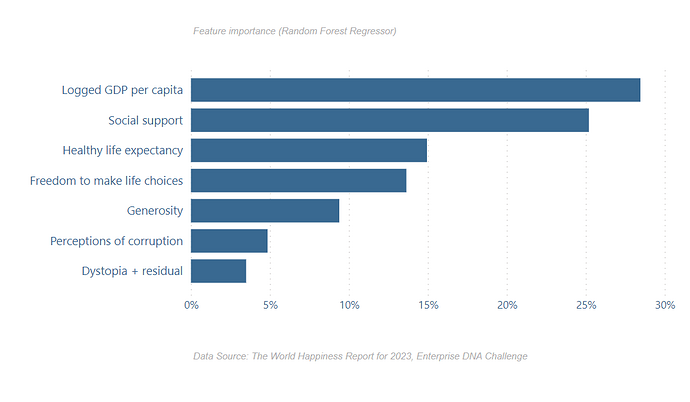
After that I try few Gaelim’s tricks how to import models in PBI and how to use feature importance. This time I used RandomForestRegressor from sklearn.ensemble to create a model.

Using that model feature importance are following (little bit different from Regression model that Sam’s used):

Hope you like it.

3 Likes

Very nice. Well done

1 Like