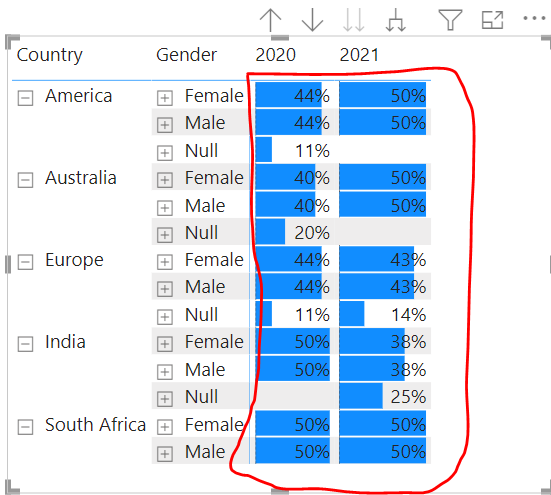
I have created Matrix table where am required to shows data bars and % of gender based on country am able to add bars with only one color blue
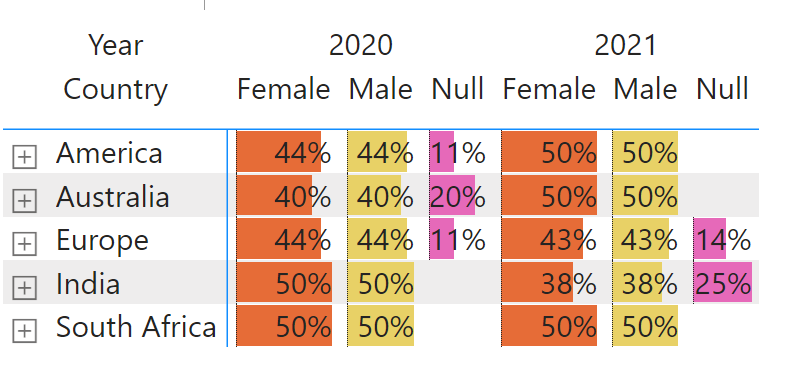
How can I add data bars with 3 different colors (Male, Female and Null)…
Screenshot and sample data attached for your reference. Test_File.pbix (56.7 KB)
Hi,
Thanks for the reply but the visual you have mentioned didn’t work when I add the hierarchy of Quarter to it, so is there any other solution or custom visual I can try