Hello everyone, I am going through the customer deep dive module in the dashboarding & data visualization intensive course and have hit a bit of a block with the lifetime profit margin measure. The visual in particular contains the profit margin and lifetime profit margin measure, where the profit margin measure encompasses a selected time frame eg. Quarter 3 of 2015 while lifetime takes all dates into account.
The issue I face is that visual’s x-axis (the dates) will include ALL dates from the date table while I am looking to only have the selected time frame appear on the x-axis like how it appears in the tutorial video.
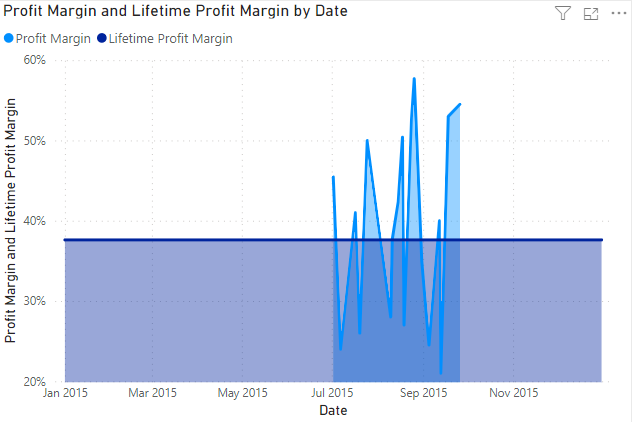
My visual:
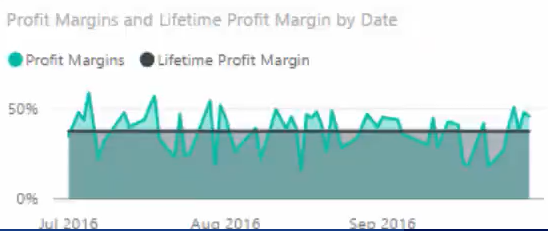
Visual in tutorial video:
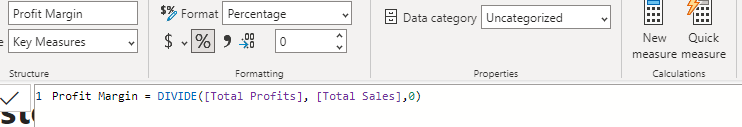
This is the DAX formula for the profit margin and lifetime profit margin visual:
Profit margin:
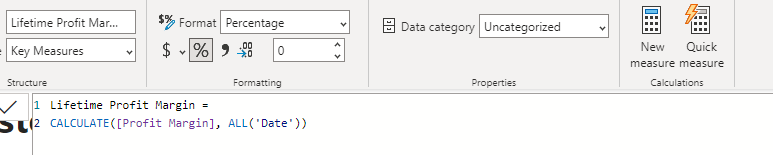
Lifetime Profit Margin:
Am I missing a part in the formula that is preventing me from “fitting” the lifetime profit margin measure to the time frame I selected, as opposed to having the visual display all dates?