Dear All,
Any Tutorial to generate attached Dashboard.
Regards
Power Bi Dashboard.xlsx (10.4 KB)
Hi @Rohit1,
You can use the same principals as in financial reporting, here’s a related course.
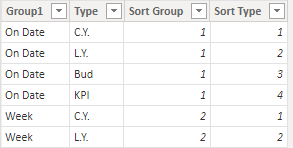
For example. You can set up a structure for visualization, something like:
Create the required measures for all your values and one SWITCH/TRUE for use in the matrix, like:
Sales KPI matrix =
VAR grp = SELECTEDVALUE('KPI table'[Sort Group])
VAR typ = SELECTEDVALUE('KPI table'[Sort Type])
RETURN

SWITCH( TRUE(),
    grp = 1 && typ =1, [Total Sales Today],
    grp = 1 && typ =2, [Total Sales Today LY],
    grp = 1 && typ =4, [Total Sales Today KPI],
    0
)
In the filter pane you can select what should be shown in the visual, like:
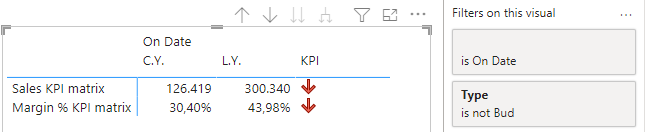
Note that you can lock and/or hide your set selection, in the filter pane as well.
For the KPI display, I created 2 conditional formatting rules in the ‘cell elements’ section

My sample file
eDNA Test Model KPIs.pbix (577.1 KB)
I hope this is helpful
Thanks , let me go through the Financial Reporting Tutorial and try to replicate SWITCH/TRUE, as im not hands on on this, will get back after 4 to 5 days.
Regards.
Hello @Rohit1, just following up if the solution provided by @Melissa was able to help you with your query?
If there won’t be any activity from you in the coming days, we’ll be marking this post as solved. Thanks.
Hi,
You can close this, as im still going through Financial Reporting tutorial, will get back in case i get stuck up.
Regards