Hi All,
I am a new bie to DAX and trying to find solutions for some questions based on Danny’s Diner use case.
I have created a pbix file with all questions and expected answers as images.
Danny’sDiner.pbix (317.6 KB)
P.S. - I have solved some of the questions but finding difficulty in achieving others.
Most of the cases in this are related to Top N or ranking analysis
Im not sure if the expected result on Q3 is possible in the way they show it, the only way I could get that was to add the customer id from the sales table, the menu item name from the menu table and use the below measure to retutn a “Y” or else a blank to display the items on the first order for each customer.
First Product Purchased =
VAR CustomerItems = CALCULATETABLE(SUMMARIZE (sales,sales[customer_id],sales[order_date], menu[product_name]),ALL(menu[product_name]))
VAR FirstOrder = TOPN (1,CustomerItems,sales[order_date], ASC)
VAR FoodList = SELECTCOLUMNS(FirstOrder,"Value1",menu[product_name])
VAR LineItem = SELECTEDVALUE(menu[product_name])
VAR Result = IF(LineItem IN FoodList,"Y")
RETURN Result
If it helps, after looking at this a bit more, I think the columns in the table examples are measures returning a value such as date etc, so you need to calculate the item to show in the column, it doesnt look like its a data model that is used to produced aggregate calculations.
One thing to note, if the customer is in the members table, thats when they are a member, theres a date of membership, so you will find non members in the sales table when filtered to before the date of joining.
Thanks Kylie for the time, could you please check the other questions also.
I believe the data model should be tweaked a bit but still trying out the best with the simple model used.
In between I was able to get Q5. with below measure.
Order Count =
Switch(
TRUE(),
RANKX (
all(menu),
CALCULATE(COUNT(sales[product_id])))<=1,count(sales[product_id])
)
Dimensions: ProductName, Customer_ID(Sales table)
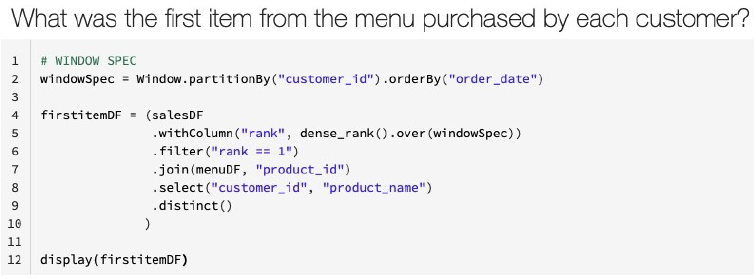
Infact below is the pyspark code written for getting the result in databricks, hope this may be helpful for
Q3.
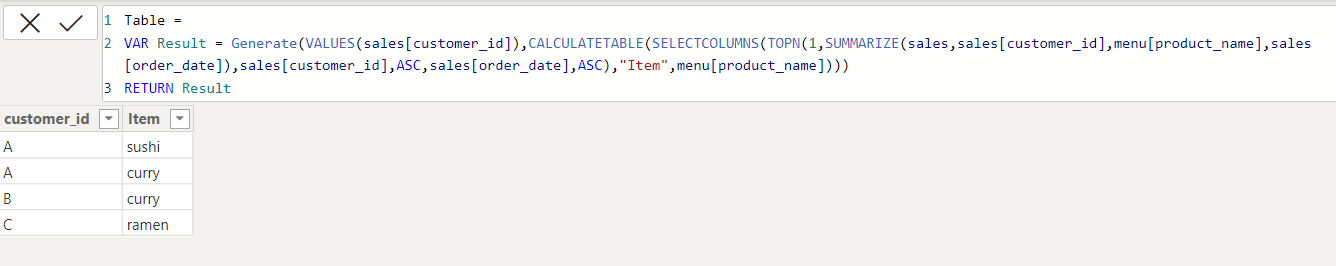
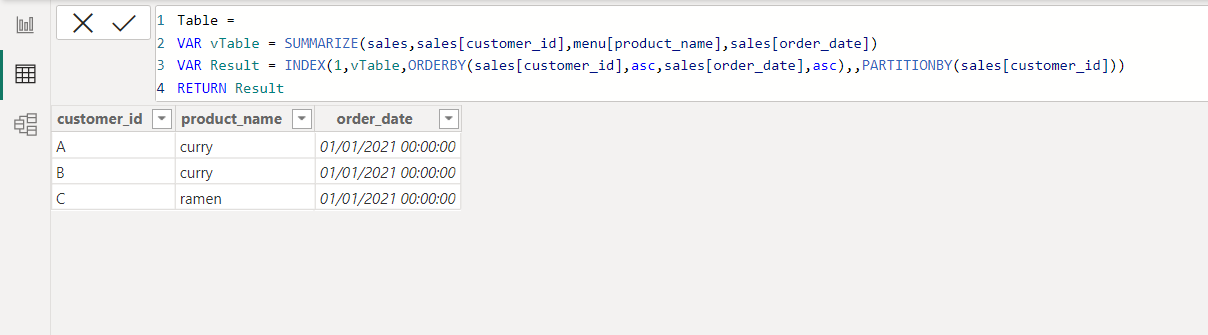
You can generate the table in DAX the issue using the index function is it will only return one value, top n will produce 2 if there is a tie, so you could use that approach to identify the rows that should be shown, and then return a 1 or a 0 and use that measure to apply a filter on the visual and only show items where the measure equals 1
The screenshots below show the tables I was able to generate in DAX but its getting the reult into a visual that is the issue, im sure someone has done this and can advise more 
Thanks for your time Kylie on the tasks
Hello @Anonymous17
Did the response from kylie solved your query?
If it did, please mark her answer as the SOLUTION.
Hi @Anonymous17
Due to inactivity, a response on this post has been tagged as “Solution”.
If you have a follow question or concern related to this topic, please remove the Solution tag first by clicking the three dots beside Reply and then untick the check box.