hi
i need a help with my dax measure to show daily hours on matrix visual. In my model every issue has its start date, end date and value of hours per day. I want to present on my matrix visual all the users, all the issues and the hours corresponding between start and end date of the issue. look at the pbi.
Project1.pbix (416.6 KB)
Hi @gregorsustarsic ,
While waiting for the community to review and respond to your issue, take advantage of Data Mentor . It offers a wealth of tools and resources that could provide immediate solutions and enhance your report-building efficiency.
Cheers,
Enterprise DNA Support Team
I’m not able to change the underlying queries - have you tried creating a new column in power query editor using the datediff function?
Mark your date table as a date table using Date[Date] as your date column.
When you do that, your matrix will get a little closer to what you’re expecting. However, all the values will be the same for all rows. That is because the two measures you have, DailyHours and DailyHours_2 sum Issues[HoursPerDay] across all Issues[User] and all Issues[SUMMARY].
You don’t want the overall sum of HoursPerDay for all users and issues. You instead want to retain the filters on user and issue imposed by the rows of your matrix when calculating the sum of hours per day.
Accomplishing that is far simpler than what you’re doing with those two measures. You only need a measure like:
Sum of Hours Per Day = SUM(Issues[HoursPerDay])
and drop it into the values well of the matrix with Users and Issues on the rows and Date in the column.
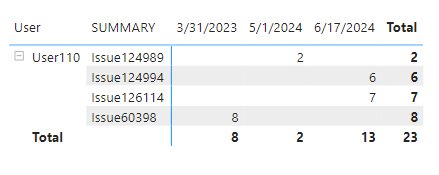
Here’s a summary of one of your users (User110):
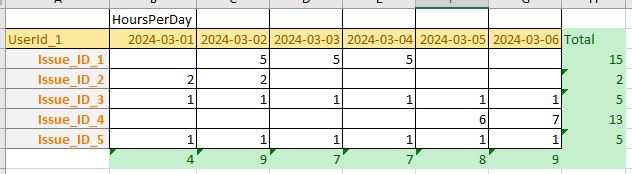
see the pbi model → but to explain better, i need measure to ignore relationship between issue[start_date] and date[date] and show daily hours between start_date and end_date for the different issues
issue_id_1 has for an example start date on 2024-03-01 and end date 2024-03-04 and dailyhours 5
I don’t see UserId_1 in the data you shared, so I can’t tell what the underlying data structure only how you’re hoping to summarize it. But I think what you are saying is that you want to display daily sums of hours per day for each user-issue, and the daily hours per day is repeated for each day within the issue’s start date and end date.
Since I don’t have access to your underlying data I can’t demonstrate the technique, but one way to handle this (in power query) is generally: creating a custom column (subtable) that lists each date for each user-issue between the Start_date and End_date then expanding and adding the hours worked to each. Essentially, you’ll be changing the grain from user-issue to day level like you’re hoping to get.
as you suggested I created a list in power query which solves the problem
updated pbi file:
Project1.pbix (454.8 KB)
but i want still to learn dax solution, if anybody will help