Hi Fellow Power BI Users -
Hope you’ve been well. I’m stuck in a bit of a rut. Seems like it’s a simple solution but for some reason I can’t find the answer to this.
Using one of your models, I’ve sorted customers by ABC =>
A - makes up cumulative sales of 70%
B - between 71% - 90%
C - 91% - 100%
What I’d like to do is show the number of customers growing (Year over year% sales > 0) and declining by A, B, C but I’m having a hard time figuring out how to do this. Could you please assist based on the sample model I’ve created.
Regards,
Avalon
PowerBI - Customer Model - Growing declining.pbix (428.9 KB)
1 Like
Definitely look to simplify things a little more here I think.
I see you’ve taken the SQLBI approach to ABC. Personally I feel it’s way to complicated than it needs to be.
See below for same results, simpler formula.
Customer Sales =
CALCULATE( [Total Sales],
FILTER( VALUES( Customer[Customer Name] ),
COUNTROWS(
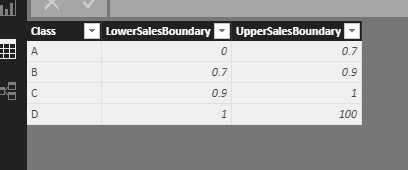
FILTER( 'ABC Analysis',
DIVIDE( [Total Sales], [LY_Sales], 0 ) > 'ABC Analysis'[LowerSalesBoundary]
&& DIVIDE( [Total Sales], [LY_Sales], 0 ) <= 'ABC Analysis'[UpperSalesBoundary] ) ) > 0 ))
I also adjusted this, because you have to remember that up to > 1 would be those that are growing year on year from a percentage perspective
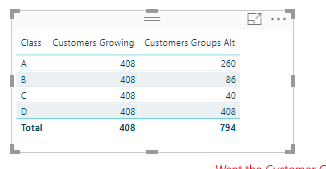
I get different results to you so not sure if this is exactly what you need but I’m confident it will make more sense using the above formula that the existing one you had
Customers Groups Alt =
COUNTROWS(
    FILTER( VALUES( Customer[Customer Name] ),
         COUNTROWS(
            FILTER( 'ABC Analysis',
                DIVIDE( [Total Sales], [LY_Sales], 0 ) > 'ABC Analysis'[LowerSalesBoundary]
                && DIVIDE( [Total Sales], [LY_Sales], 0 ) <= 'ABC Analysis'[UpperSalesBoundary] ) ) > 0 ))
Use this formula for the Customers growing also
Hi Sam,
Thank you for the solution. I’m not sure I fully understand your definition of ABC in the code above.
My understanding of ABC per sqlBI and industry terminology is as follows:
A - top customers that make up overall 70% of your cumulative total current sales (not based on PY)
B - the next group of customers that make up 71%-90%
C- the remaining customers
From the ABC code above it seems like a different definition of ABC, where D are actually your top performing customers based on Year over year change. I don’t think it highlights your highest revenue earning customers. Am I understanding your code right? Your solution is definitely a simpler formula but not sure if it meets the industry definition of ABC which I’m looking for.
Ok yes sorry, I’ve gone off in slightly different direction.
But check out the below video. It also perfectly explain how to make small adjustments to get a more ABC type calc.
I still think this revised way is much simpler.
Check it out and let me know how it goes.
